04.10 Berlin Climate Modelling – Climate Analyse Maps 2022

Statistical Base

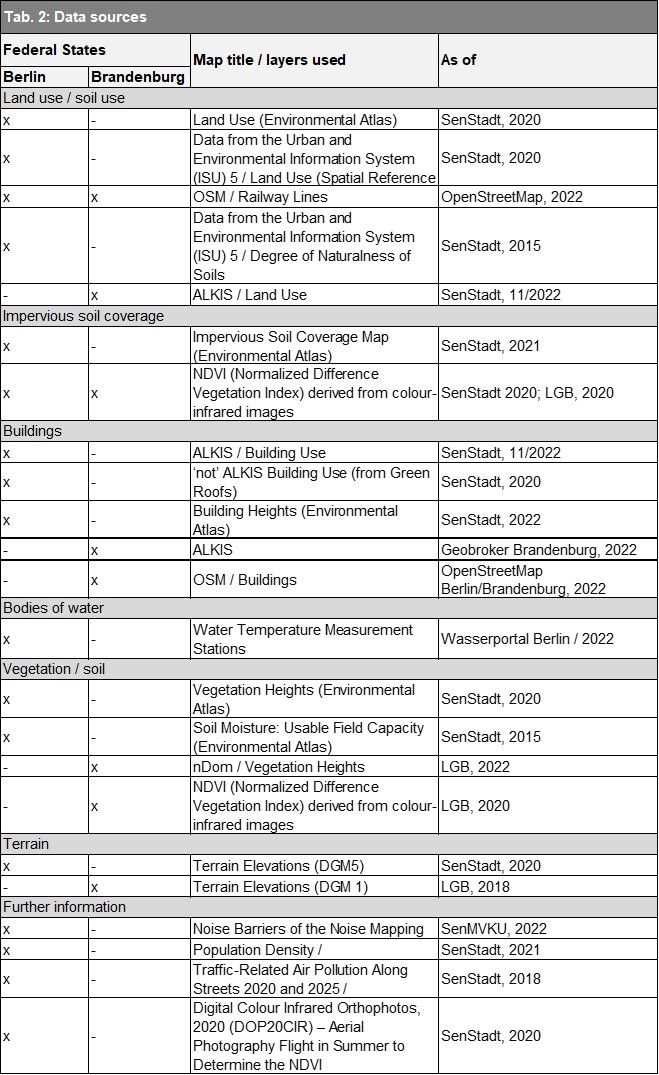
The input grid, which forms the basis for subsequent climate modelling, is generated through the processing of the underlying data. Several processing steps are required to reach this stage. These include (1) defining the study area, (2) compiling and analysing relevant data sources, and (3) designing the query process used in climate modelling. In addition, (4) long-term measurement station data is also assessed to determine the initial temperature for each climate simulation.

Defining the Study Area

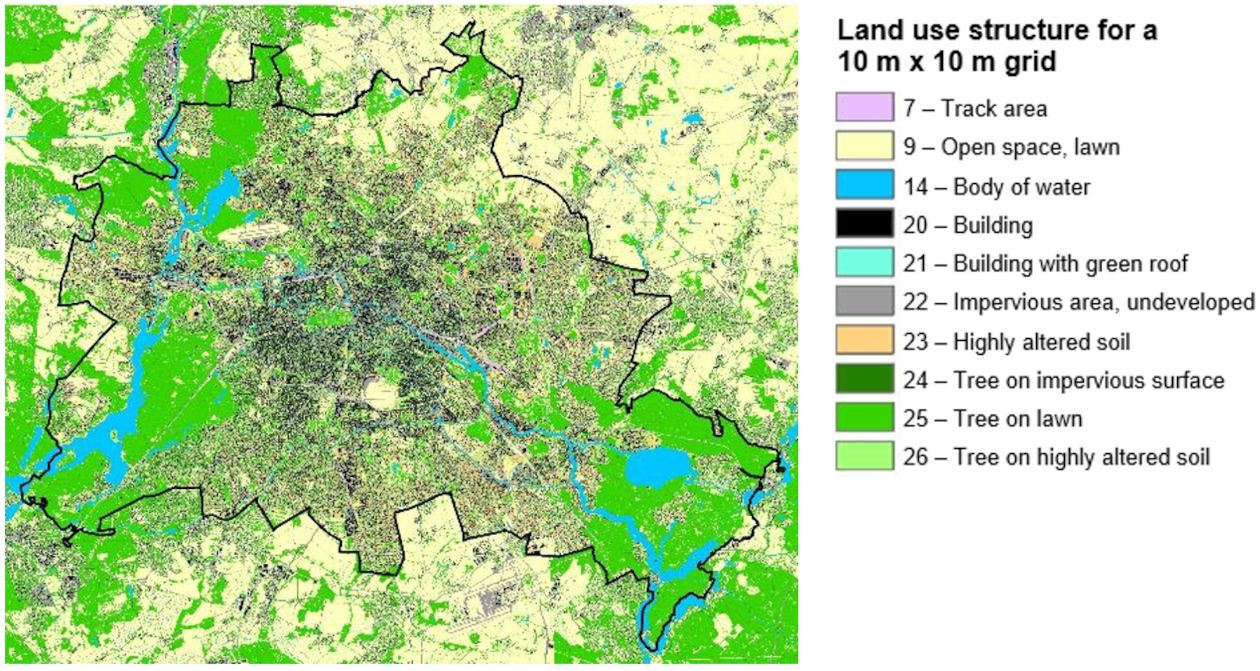
Numerical simulation models require a simulation area that extends beyond the actual region being studied and includes the area covered by the underlying data sources and the meteorological boundary conditions. For the citywide climate modelling, this means that not only Berlin itself but also the surrounding regions are incorporated. The modelling area is thus divided into Berlin’s urban territory of 890 km² and its surroundings of roughly 900 km² (cf. Figure 1). By using a sufficiently large input area, the model has space to reach equilibrium or ‘settle’, enabling it to simulate conditions within the city that are as realistic as possible. The citywide climate modelling is based on a study area spanning 1,886 km².

Fig. 1: Extent of the study area and land use classification for modelling purposes

Fig. 1: Extent of the study area and land use classification for modelling purposes

Land use was categorised into 11 classes to meet the requirements of the FITNAH-3D model.

Input Data

The quality of the model results heavily depends on the level of detail of the input data. The chosen grid resolution of 10 m x 10 m, which lies between microscale and mesoscale modelling, requires high-resolution spatial land-use data. Detailed information on how the model input data is prepared, along with the underlying sources, can be found in the relevant documentation (SenStadt 2025a, available in German only).

A wide range of input data was used, as shown in Table 2. The datasets differ between Berlin and Brandenburg.

Among the most important input data are maps 06.10.1 ‘Building Heights’ and 06.10.2 ‘Vegetation Heights’ (SenStadt 2020). Some of the recorded attributes describe the building or vegetation object itself, including ‘area size’; ‘maximum, minimum, and mean height’; ‘land use according to the ALKIS object type catalogue’; and ‘green roof, yes/no’ (attributes translated from German). Other attributes link each record to the official building IDs and block (segment) area IDs from the Urban and Environmental Information System (ISU5 2020). In addition to the approximately 770,000 building objects recorded in ALKIS (as of November 2022), about 70,000 additional structures, such as sheds, garages, cottages, and other ‘not’-ALKIS objects, were incorporated using the above-mentioned building and vegetation height datasets. Due to their high level of detail, this data forms an important foundation for the current climate modelling.

Tab. 2: Data sources

Tab. 2: Data sources

In some areas, the model input data described above is supplemented with land-use details from the Urban and Environmental Information System (ISU) or rather its high-resolution vector data at a 1:5,000 scale (ISU5 2020). This is especially true for information on bodies of water, road areas, and track areas. While high-resolution building and vegetation data was available for both Berlin and its immediate surroundings, data on impervious soil coverage was limited to city itself. Further surface structure information was extracted from ALKIS data, compiled by the State Office for Land Surveying and Geoinformation Brandenburg (LGB). For more details on the input data, please refer to the documentation (SenStadt 2025a).

Query Process

The model calculations rely on grid-based representations generated from the input data. For this purpose, the area geometries were converted into 10 m x 10 m grid cells with a uniform land use classification. This process was carried out through a multi-stage cascading query, as illustrated in Figure 2.

Fig. 2: Data sources and workflow for the application of the FITNAH-3D climate model

Evaluation of Long-Term Measurement Stations

Long-term data series from Germany’s National Meteorological Service (DWD) are analysed to assess current climate conditions in the Berlin metropolitan region. Climate trends across four reference periods are examined in a dedicated evaluation, drawing on data from selected measurement stations in Berlin and Potsdam (SenStadt 2025b, available in German only). The stations included in the analysis are Buch, Tegel, Tempelhof, Alexanderplatz, and Dahlem.

Contact

Leilah Haag