Changes in 2022
The 2022 water-balance modelling results show clear differences from those of 2017 in certain areas and can only be compared to a limited extent. These variations are mainly due to updates in the modelling methods and data sources:
- For the first time in 2022, road areas were analysed separately from block (segment) areas, resulting in a complete, visually continuous map of the urban water balance. This was possible due to separate datasets and updates to the ABIMO model developed under the AMAREX research project.
- Many of the apparent differences between 2017 and 2022 stem from much more detailed data on areas connected to sewer systems. Until 2017, it was generally assumed that any surface adjacent to a separate or combined sewer system was also connected to it. In 2022, for the first time, data on individual connection points was available for each block (segment) area. Road areas could also be linked directly to specific rainwater drainage connections (BWB 2022). Instead of assigning connections by land-use category (for example, it was assumed that all parks were unconnected until 2017), each area was now classified individually across the entire city.
This change mainly affected surface runoff and infiltration on the outskirts of the city. Here, it is often the case that only road areas, but not block (segment) areas, are connected to the sewer system. Consequently, the 2022 dataset reflects actual conditions much more accurately than the 2017 version.
As a side-effect, a small number of road sections (around 30) in the city centre now appear as outliers in the 2022 infiltration map. These areas (for example, ID 0000000001000806 on Taubenstraße near Gendarmenmarkt) are listed as unconnected to the sewer system, despite being highly impervious (100 % in this example). As a result, the ABIMO model calculates infiltration only, disregarding surface runoff. This leads to unrealistically high infiltration rates of more than 450 millimetres. These figures are not realistic and should be corrected in future, either in the source data or within the ABIMO model itself. - The 2022 model referred to the Green Volume Number (GVZ) for each block (segment) and road area, rather than the previously used standard evapotranspiration rate assigned by land use. This has led to major differences compared with 2017, particularly in parks.
The contrast is especially evident in large green spaces: the Großer Tiergarten now shows evapotranspiration levels of over 500 millimetres, while the green areas at Tempelhofer Feld display rates around 370 millimetres.
Therefore, using area-specific vegetation data evidently results in a more realistic representation of evapotranspiration in the ABIMO model. This has also led to considerable deviations for farmland, since, up until 2017, models relied on standard values. - New specifications for the Infiltration without Consideration for Impervious Soil Coverage Map:
For the reference scenario representing a natural water balance, the imperviousness was not only reduced to 0 % (as in 2017), but previously impervious areas were now modelled as urban park areas with a mix of vegetated and tree-covered surfaces (yield class = 50).
Map Description
The Total Runoff Map (02.13.3) shows that in the highly impervious inner-city areas (within the S-Bahn ring) total runoff ranges between 350 and 450 millimetres per year. Values are even higher in the densely built-up city centre and in some industrial areas. Here, only about 150 millimetres per year evaporates (see Map 02.13.5), based on precipitation readings taken at a height of one metre, which are roughly 10 to 15 % lower than at ground level. In the less densely developed outer areas, total runoff ranges from 250 to 350 millimetres per year. By contrast, pervious areas on the outskirts and in the surrounding regions, where runoff is around 150 millimetres per year, highlight Berlin as an island of substantially increased runoff. The reduction in evaporation due to impervious soils and limited vegetation – as illustrated in the Evaporation Map (02.13.5) – leads to runoff rates that are two to three times higher than under natural conditions.
Groundwater depletion occurs only in a few areas where both precipitation and the water table are low. In these locations, vegetation taps groundwater reserves and can evapotranspire more water than is replenished by rainfall, leading to a local runoff deficit.
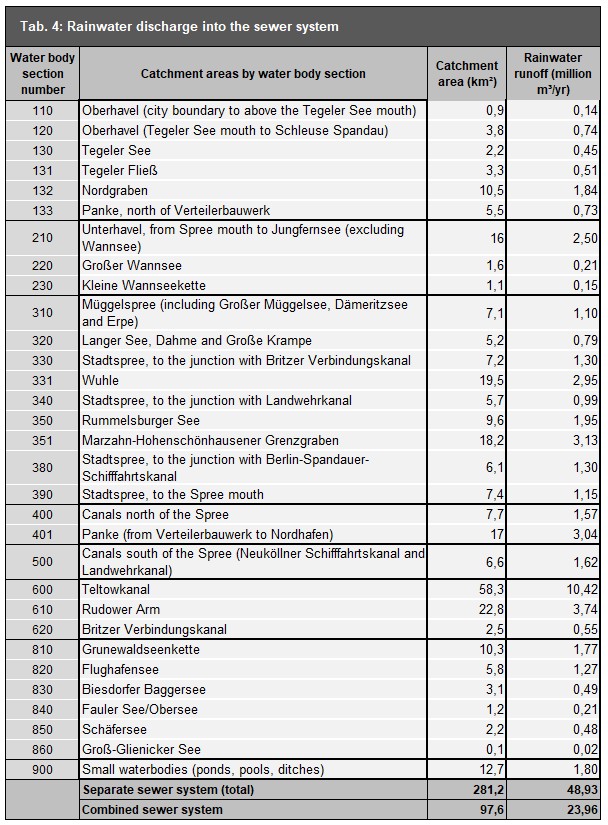
The Surface Runoff Map (02.13.1) indicates that in inner-city areas connected to the sewer system, an average of about 250 millimetres per year of runoff enters the sewers, with peak values exceeding 400 millimetres per year. In the outer areas connected to the sewer system, average figures reach around 100 millimetres per year.
The Percolation Map (02.13.2) illustrates that in the inner city, around 100 to 150 millimetres of rainwater infiltrates into the ground per year. Much higher infiltration rates, about 250 millimetres per year, are found in the more open residential areas in the outer regions, such as the large housing estates and high-rises built between the 1960s and 1990s in Marzahn. In regions with low sewer system connection rates, infiltration can reach up to 300 millimetres per year. In unconnected areas, all runoff infiltrates into the soil, averaging 300 to 350 millimetres per year with peak values of over 400 millimetres. By contrast, infiltration rates are relatively low in the forests with only 50 to 100 millimetres per year. Much of the rainwater is returned to the atmosphere in these areas, leaving only a small amount to infiltrate into the soil.
In summary:
- The reduction in soil permeability caused by the high degree of impervious surfaces in the inner city is largely offset by lower evapotranspiration rates. Consequently, infiltration rates in the inner city are higher than expected, approaching those under natural conditions.
- Infiltration rates are primarily influenced by the sewer system connection rate, with the extent of impervious coverage being the second most important factor. Additional key factors include the type of surface material and its capacity to allow infiltration.
- In less densely built-up areas with low connection rates, infiltration rates are the highest, approximately twice those observed under natural conditions.
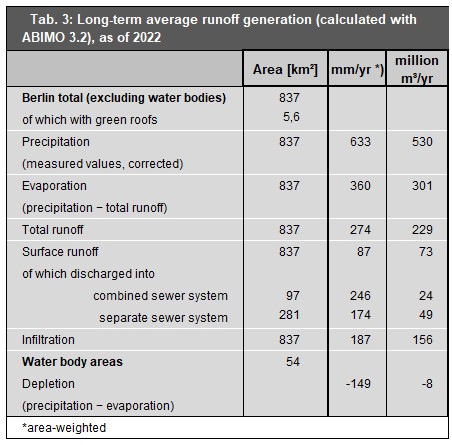
Evaporation from water bodies, which are not included on the maps, exceeds direct precipitation by around 160 millimetres per year, resulting in an annual net water loss of approximately 8 million cubic metres from Berlin’s lakes and rivers.
For some of the highly impervious areas, no information was available on whether rainwater is discharged through the sewer system. In these cases, all runoff has been classified as infiltration on the maps. However, given the degree of imperviousness and the volume of runoff involved, it is unlikely that all of this water infiltrates into the ground. Consequently, surface runoff is likely underestimated, while infiltration is slightly overestimated. This also applies to the road sections (around 30 in total) in the city centre (for example, 0000000001000806 on Taubenstraße near the Gendarmenmarkt).
The total runoff volumes were derived from the mapped reference areas and subsequently quantified (see Table 3).