New

The Environmental Atlas maps are available in the new Map Application

Water Balance 2022

Methodology

In the mid-1990s, a model was developed, programmed, and applied in collaboration with the Federal Institute of Hydrology (Berlin Branch) to calculate the key components of the water balance.

The water-balance model ABIMO, designed by Glugla, was based on models originally developed in the 1970s to calculate available groundwater resources. It was subsequently expanded with modules to address the specific conditions of urban environments. This development was supported by expert reviews performed by the TU Berlin’s Institute of Ecology (Soil Science), and by a diploma thesis completed at the FU Berlin’s Department of Geography. The computational implementation, carried out by an external software company, was also adapted to the particular data environment of Berlin. Since 2022, ABIMO has been available as open-source software (version 3.2) at https://github.com/umweltatlas/abimo (available in German only).

As part of the AMAREX research project, ABIMO 3.2 was further developed, including the conversion of the application from C++ to R. This updated version is also available as open-source software at https://github.com/KWB-R/kwb.rabimo. The updated model was used to revise the 2022 water-balance maps. An overview of the workflow is shown in the 2025 Flow Chart.

The calculation process first determines actual evapotranspiration, in order to compute total runoff (precipitation minus evapotranspiration). In a second step, surface runoff is calculated as part of the total runoff. The difference between total runoff and surface runoff represents the infiltration component. Figure 2 illustrates the complexity of this process.

Fig. 2: Flow chart of the ABIMO model

Fig. 2: Flow chart of the ABIMO model

Total runoff is estimated by subtracting actual evapotranspiration from the long-term annual mean precipitation. Actual evapotranspiration reflects average conditions across sites and regions and depends mainly on precipitation, potential evapotranspiration, and the average storage capacity of the surfaces where evapotranspiration takes place. When moisture is sufficient in these surfaces, actual evapotranspiration approaches potential levels, with greater storage capacity (such as higher soil water retention or deeper rooting) leading to higher evapotranspiration rates.

The relationship between the long-term means of actual evapotranspiration on the one hand and precipitation, potential evapotranspiration, and site evapotranspiration effectiveness on the other conforms to the Bagrov relationship (see Glugla et al. 1971, 1976; Bamberg et al. 1981; Fig. 3). This relationship, derived from long-term lysimeter experiments, expresses how actual evapotranspiration responds nonlinearly to precipitation, depending on site characteristics. Based on the Bagrov relationship, and given the climatic parameters precipitation P and potential evapotranspiration EP (expressed as the P/EP ratio), together with the site-specific effectiveness parameter n, the ratio of actual to potential evapotranspiration (ER/EP) can be determined. This makes it possible to calculate actual evapotranspiration ER for sites and regions not influenced by groundwater. For areas affected by groundwater, a modified version of the Bagrov method is applied, which adds the mean capillary rise from the groundwater to the precipitation input.

Fig. 3: Representation of the Bagrov relationship for selected values of the parameter n, and dependence of n on land use and soil type

Fig. 3: Representation of the Bagrov relationship for selected values of the parameter n, and dependence of n on land use and soil type

As precipitation P increases, actual evapotranspiration ER approaches potential evapotranspiration EP, so that the ratio ER/EP tends towards 1. When precipitation P decreases (P/EP approaches 0), actual evapotranspiration ER approaches the amount of precipitation P itself. How quickly these values are reached depends on the storage capacity of the evaporating surface, expressed by the effectiveness parameter n.

A site’s ability to store water is mainly determined by its land use and soil type. In terms of land use, storage capacity generally increases in the following order: impervious areas, fallow areas, agricultural areas, horticultural and forest areas. With respect to soil type, storage capacity improves as the soil’s binding capacity increases.

Storage capacity in pervious soils is expressed as the available water capacity, defined as the difference between soil moisture at field capacity (the onset of percolation) and at the permanent wilting point (when plants experience irreversible drought stress). Other land-use factors, such as yield per hectare, tree species and age, also influence the value of n. The parameter was established through analysis of data from numerous lysimeter stations, both domestic and international, and from water-balance studies in river catchments.

In areas with shallow groundwater, evaporation increases in the soil zone affected by evaporation due to capillary rise from the groundwater. The extent of this rise depends on groundwater depth and soil properties. As a result, runoff generation decreases. Where actual evapotranspiration exceeds precipitation, water is consumed from the soil, and runoff can become negative, as occurs, for example, in river and lake lowlands.

Over water surfaces, potential evaporation is higher than over land because of the greater heat supply, that is, lower reflectivity of incoming radiation. Actual evaporation from water bodies is generally assumed to be approximately equal to this higher potential evaporation.

Localised infiltration, such as that from groundwater recharge facilities operated by waterworks, was not taken into account. For horticultural uses (allotment gardens, weekend cottages, parks, cemeteries, tree nurseries/horticulture, and for some residential or public/special uses), an approximate value of 50 to 100 millimetres per year was added to precipitation to account for irrigation.

After the mean total runoff is calculated as the difference between precipitation and actual evapotranspiration, surface runoff is determined in a second step. For roof areas connected to the sewer system, surface runoff equals total runoff. Areas that are not connected do not contribute to surface runoff. Undeveloped impervious areas allow part of their runoff to infiltrate into the subsoil, depending on the type of surface material (pavement type). The infiltration factor depends on the width, age and condition of the joints between paving elements. Runoff that does not infiltrate into the soil is directed into the sewer system, depending on the connection rate. If it does not enter the sewer system, it seeps into the soil along the edges of the impervious surface. Similarly, portions of runoff from unconnected roof areas also infiltrate into the ground (see Table 1). The difference between total runoff and surface runoff therefore represents infiltration, which forms the basis for estimating groundwater recharge. Evapotranspiration for each block (segment) area is then calculated as the difference between corrected precipitation (precipitation multiplied by the standard correction factor 1.09 for Berlin) and total runoff.

To apply this method in urban areas, the parameter n and the infiltration factor Fi had to be determined for different types of impervious surface materials. For this purpose, lysimeter experiments using various surface materials and calculations of wetting losses were evaluated (see Wessolek & Facklam, 1997). The selected parameter values are listed in Table 2. Changes in these parameters resulting from surface ageing, caused by compaction or silting of joints, were also considered. However, due to remaining gaps in the scientific data, these values still involve a certain degree of uncertainty. From a hydrological perspective, it would be desirable to revise the current grouping of surface materials into pavement classes.

Tab. 2: Effectiveness parameter n and infiltration factor Fi by pavement class

Tab. 2: Effectiveness parameter n and infiltration factor Fi by pavement class

To determine infiltration without the impact of impervious soil coverage (Map 02.13.4), the input data was adjusted so that imperviousness was set to 0 % for all areas. The vegetation type was set to urban park area with a mix of vegetated and tree-covered surfaces. For other actual green land uses, such as forests, no changes were made.

Separation of block (segment) and road area modelling (2022)

Version 3.2 of the water-balance model is specifically adapted to Berlin’s datasets and, in particular, to the spatial reference system of the Urban and Environmental Information System (ISU). For many years, road areas were not mapped in the ISU as a separate land-use category, and their surface shares were therefore included within the block (segment) areas.

With the introduction of the ISU 2020 spatial reference system, detailed road-area data became available for the first time. As part of the AMAREX research project, the ABIMO model was further developed so that road areas could be analysed independently from the block (segment) areas.

To achieve this, the columns referring to road surface shares were defined as optional fields in the input format. In the new dataset, the road area category possesses the same data structure as that of block segment areas. Both are processed in the same way by the model.

While the separation was carried out, an error was also corrected. In the earlier infiltration calculation, the inclusion of road surface shares within block (segment) areas had led to an overestimation of the proportion of pervious surfaces.

Use of individual evapotranspiration parameters (2022)

Within the AMAREX research project, the ABIMO model was further developed to include data from the 2020 Green Volume Number (GVZ, see Environmental Atlas Map 05.09) to determine specific evapotranspiration parameters for each block (segment) and road area. This replaces the earlier, standardised assignment based solely on land use or area type within the model.

A normalised vegetation index was derived from the ratio of vegetation volume to pervious surface area, using the base volume data. This index was then linearly scaled to match the range of the original vegetation classification. As a result, urban blocks commonly ranged between a number of 20 and 30, while larger parks went up to 50. A realistic distribution was achieved through an exponential adjustment of the scaling and a cap at 75 (the value assigned to forests). The approach was verified using several well-known parks, including the Tiergarten and Hasenheide. The resulting scaled values now serve as new, refined input parameters for evapotranspiration modelling.

Including the influence of green roofs in water-balance data

Based on the comprehensive spatial data on green roofs provided in Environmental Atlas Map 06.11 Green Roofs, it has been possible to include the effects of green roofs in the water-balance calculations since 2017.

The green-roof calculation was integrated directly into the ABIMO model as part of the AMAREX research project. As the original ABIMO model did not explicitly account for green roofs, a method was developed to incorporate their effects into the overall water balance.

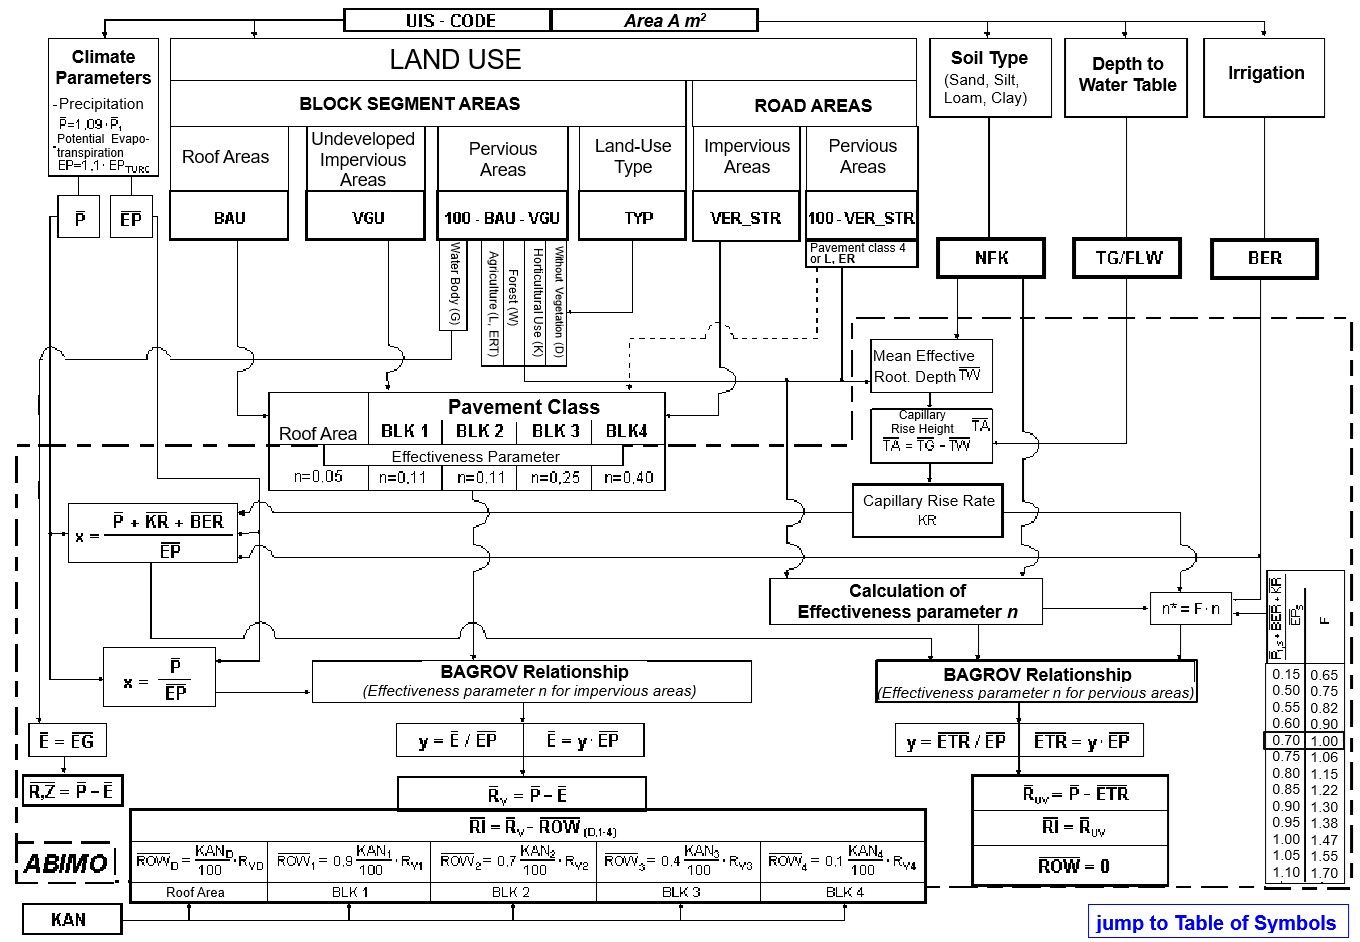
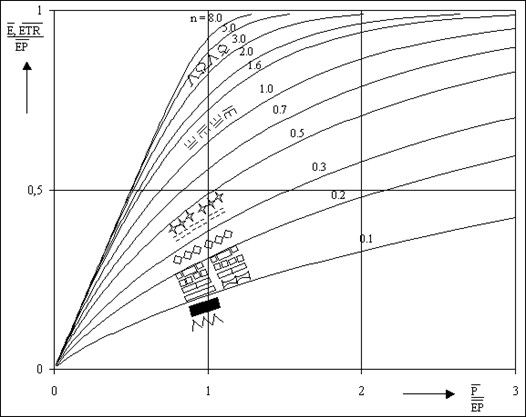
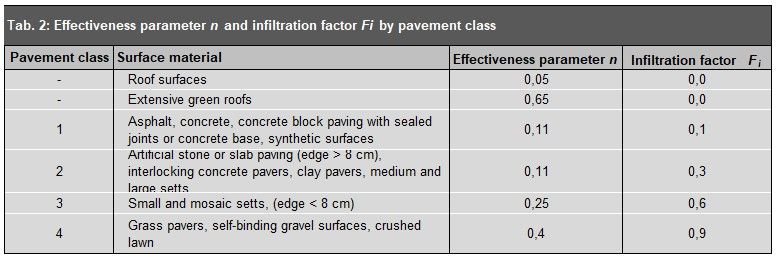
To this end, a ‘green roof’ category was introduced as a new surface material in ABIMO. This category was assigned both a Bagrov parameter n (see Figure 3) and an infiltration factor Fi (see Table 2), following the same procedure used for the other surface categories. Infiltration was set to 0, as for the standard ‘roof’ category; however, the parameter n was adjusted to regulate evapotranspiration, enabling the model to account for the higher evapotranspiration of green roofs.

To determine the parameter n, the WABILA water-balance model (DWA, n.d.) was used. WABILA enables detailed simulations of rainwater management measures and provides precise water-balance results. Evapotranspiration was calculated separately using both ABIMO and WABILA. The adjustment factor, parameter n, that produced the closest agreement between the two models across most climate scenarios was then selected.

Option to integrate the effects of infiltration basins (2022)

The need has emerged to incorporate rainwater management measures into the water-balance model. This has already been implemented for infiltration basins as part of the AMAREX research project. However, as no citywide spatial data on infiltration basins is currently available, these features could not be included in the 2022 maps. Nevertheless, the AMAREX Web Tool (https://amarex-staging.netlify.app/amarex, available in German only), gives users the option to include infiltration basins in their planning.

For this purpose, the proportion of runoff-generating surface area connected to an infiltration basin is specified as an additional input parameter. The model assumes a conceptual basin: a small fraction of the inflowing water evaporates, while the rest infiltrates fully. The exact share that evaporates is defined by a parameter in the configuration file, which specifies the fraction of inflow that is lost through evaporation.

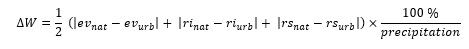
ΔW (Delta W): Deviation from the natural water balance (2022)

The German Association for Water, Wastewater and Waste (DWA) defines the objective of urban water management as ‘keeping the number and magnitude of changes to the natural water balance caused by urban development as low as is technically, ecologically, and economically feasible’ (translated from DWA, 2022).

To capture this, the AMAREX research project introduced the parameter ΔW (Delta W), which quantifies how much an urban water balance deviates from its idealised natural state:

Water balance 2022

ΔW compares the three main components of the water balance – evaporation / evapotranspiration (ev), infiltration (ri), and surface runoff (rs) – with those of the natural reference scenario. The result is expressed as a percentage between 0 and 100.

For the reference scenario representing a natural water balance, the model assumes a fully pervious, undeveloped area in an urban park, consisting of a mix of vegetated and tree-covered surfaces, with a yield class of 50.

Technical updates in the model (2022)

As part of the AMAREX research project, ABIMO 3.2 was further developed. The following provides a brief overview of the model’s technical updates:

  • The C++ application was rewritten in R. The model code was translated into English and is available as open source software at https://github.com/KWB-R/kwb.rabimo.
  • To improve transferability to other cities, the model logic was generalised. Berlin-specific input variables, such as urban structure type and land-use category, were removed from the model code. Instead, parameters derived from these, such as yield and irrigation, were included directly as input variables. Parameters that were previously hard-coded in the model, such as potential evapotranspiration, can now be defined flexibly through input data. This allowed the model to be successfully transferred and applied to the city of Cologne.

AMAREX Web Tool

The AMAREX Web Tool (https://amarex-staging.netlify.app/amarex, available in German only) is a prototype planning tool that allows users to select any area within Berlin and apply various measures, such as removing impervious soil covers, adding green roofs, or connecting areas to infiltration basins. For the selected measures chosen for planning, the tool displays water-balance parameters both for the current situation and the scenario after implementation. Results can be saved, reloaded, and printed as a report.

Users can work in two modes:

  • Neighbourhood level: multiple block (segment) and road areas can be selected simultaneously. Measures are then applied uniformly across the chosen area using sliders. The tool ensures that measures are applied logically across the selected area. For example, if a target of 30 % green roof coverage is set, the tool will not ‘downgrade’ roofs that are already more extensively greened. Instead, it will add greening only to roofs without vegetation or with less vegetation.
  • Local level: In this mode, a single area can be selected. Pre-configured measures can then be placed at specific points within it, enabling detailed, site-specific planning. The exact positioning of a measure within an area has no influence on the model calculations, however, and serves purely to aid visualisation within the planning tool.

Results

The model produced updated long-term means for roughly 25,000 block (segment) areas and 32,000 road areas. It provides data on total runoff, evapotranspiration, surface runoff, and infiltration, taking into account the influence of green roofs. On the maps, these values are displayed as classified figures in millimetres per year, while total annual volumes (in cubic millimetres per year) were also calculated and quantified. It should be noted that these averages reflect conditions across block (segment) and road areas that may appear uniform but are in fact heterogeneous. Runoff from impervious and pervious surfaces is aggregated into a single value for each area. This means the maps do not show, for example, the infiltration capacity of one square metre of pervious or unpaved soil. For this purpose, another separate citywide, block-specific calculation was performed assuming entirely pervious conditions. The results are shown in Map 02.13.4. For the first time, the deviation from the natural water balance, ΔW, is also included.

Contact

Leilah Haag