The data used to calculate runoff volumes was provided by the Berlin Urban and Environmental Information System (ISU5, 2020) for around 25,000 block (segment) areas, and for the first time also for roughly 32,000 road areas within the ISU spatial reference system.
The 2020 land-use data is based on the evaluation of aerial imagery and additional geodata (see Environmental Atlas maps 06.01, 06.02 and 06.08). It distinguishes 22 land-use categories and 52 area types. This information plays an important role in the water-balance model. Where location-specific data is not available for core input parameters, standard averages for each land-use category or area type are applied at block or block-segment level. For 2022, this mainly concerns the allocation of sewer system connection rates (see below).
As part of the AMAREX research project, the ABIMO model’s evapotranspiration parameters were assigned to each block (segment) and road area on the basis of the Green Volume Number (GVZ) from 2020 (see Environmental Atlas Map 05.09). This replaced the previous standard assignment based solely on land use.
Long-term mean precipitation for the period from 1991 to 2020, including both annual averages and averages for the summer season (May to October), were aggregated from HYRAS-DE-PRE data provided by Germany’s National Meteorological Service (DWD) for block (segment) and road areas (see Environmental Atlas Map 04.08). These were then used in the water-balance modelling.
Long-term means of potential evapotranspiration, calculated using the TURC method and increased by 10 %, were derived from climate station observations across the Berlin region. For the city area, borough-level averages between 660 and 672 millimetres per year and between 505 and 513 millimetres for the summer season (May to October) were assigned.
The degree of impervious coverage was determined using multiple methods: evaluating ALKIS data (Official Real Estate Cadastre Information System) for built-up impervious areas, analysing high-resolution multispectral satellite imagery and other geodata for undeveloped impervious areas, and assessing road-survey data for road areas collected for the Environmental Atlas (see Environmental Atlas Map 01.02, 2021). The dataset distinguishes between built-up impervious areas (roof areas) and undeveloped impervious areas (such as parking lots and footpaths). For undeveloped impervious areas, the proportion of each surface material present was an important input variable. The materials were grouped into four pavement classes, and five classes for road areas (see Table 2). They were measured in the field at representative sites for each area type and then applied to all block (segment) areas of the same type.
The soil-scientific characteristic data on the available water capacity of soils in the shallow-root zone (0 to 30 cm) and the deep-root zone (0 to 150 cm) was taken from the Soil Association Map of Berlin – Available Water Capacity of Soils (see Environmental Atlas map 01.06.2, 2020).
Water table measurements from 2009 were used, representing a year with average groundwater levels (see Environmental Atlas Map 02.07).
Information on the sewer system was taken from the Map Management of Rain and Waste Water (see Environmental Atlas Map 02.09, 2022). For the first time, block (segment) areas were evaluated based on connection points, recording whether rainwater from each block (segment) area is discharged into the sewer system. In addition, data from the BWB (2022) was used to assess road areas for the first time, showing whether a road section is connected to the sewer system. As the classification was carried out at block (segment) level, all impervious surfaces within a block (segment) area are treated as connected to the sewer system in the water-balance model, even though, some parts may not actually be connected. This also applies to areas subject to decentralised rainwater management, for which no comprehensive Berlin-wide data was available at the time of mapping.
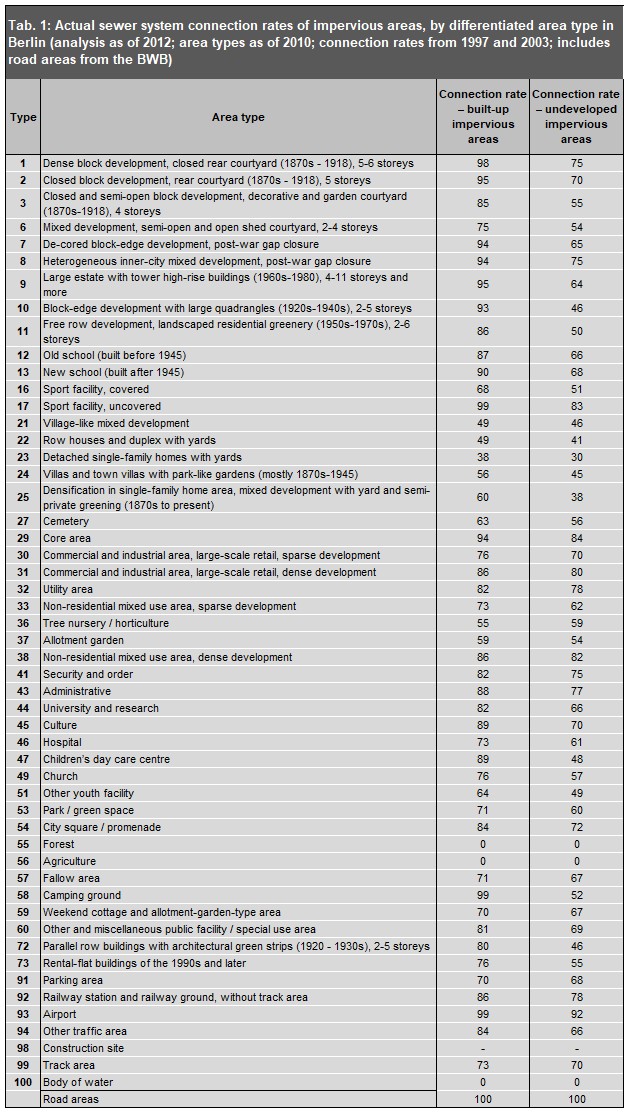
The Type of Drainage Map does not indicate the extent to which rainwater from built-up or impervious areas is actually discharged into the sewer system. To address this, an in-depth analysis was carried out for the 2005 water-balance mapping. Two data sources were available for estimating actual sewer system connection rates. The first was the set of standard values for each area type determined in a 1997 diploma thesis by Bach. The second data source was compiled by the BWB as part of the reorganisation of the wastewater charge structure. This involved a property-level survey of impervious areas, distinguishing between those connected and not connected to the sewer system. The aim of the survey was to allocate the costs of rainwater disposal as accurately as possible according to the polluter-pays principle. This data was also captured in mapped form and aggregated to the reference areas of the ISU spatial reference system before being shared with the Senate Department. However, analysis revealed that the BWB’s mapped data did not cover the entire city. Therefore, the raw data could not be used in the Environmental Atlas water-balance model without further processing. Based on the assumption that the connection rate is closely linked to the age and structure of built-up areas, means were therefore calculated for each area type using the BWB data, combined with the urban structure type maps covering the entire urban area (see Environmental Atlas maps 06.07 and 06.08, 2010). These means were then applied as standard parameters to all areas connected to the sewer system of the same area type. The results are summarised in Table 1. A comparison of these values with those determined by Bach (1997) showed good overall agreement. Only the connection rates for some of the undeveloped impervious areas in green and open spaces with little or no building development deviated significantly from Bach’s figures. Since the analysis of the BWB dataset indicated that undeveloped impervious surfaces – especially in these areas – were poorly or incompletely recorded, Bach’s original values were retained for this urban structure type. The actual connection rates for road areas could, for the first time, be adopted without modification from the BWB (2022) data. Where a road section was identified in this dataset as connected to the sewer system, it was included at 100 % in the water-balance modelling. Table 1 presents the standard connection rates by area type that were incorporated into the 2022 water-balance calculations.