This section discusses the results of all individual model simulations collectively. To make the document easier to navigate, links are provided for each topic. Information is included on meteorological parameters, evaluation indices, and threshold days. Additionally, a climate analysis map summarising the findings is available. The urban climate analysis focuses on the impact of key parameters such as wind and temperature as well as derived variables like the Physiological Equivalent Temperature (PET), which are particularly relevant when evaluating the biometeorological impact on humans and air quality.
Each topic is further differentiated by spatial structure (grid or block-based), time point or elevation. These are represented by separate layers that can be toggled on or off via the layer control in the Geoportal Berlin (available in German only). Analysis maps 04.10.1 to 04.10.5 as well as maps 04.10.8 and 04.10.9, are available in both grid and block-based formats. In these maps, the values shown represent the unweighted statistical mean of either the block (segment) areas or the grid cells intersecting with road areas. The Climate Analysis Map (Map 04.10.7), however, is only available in block-based format, as it was not directly modelled but derived from grid-based climate modelling results.
Background
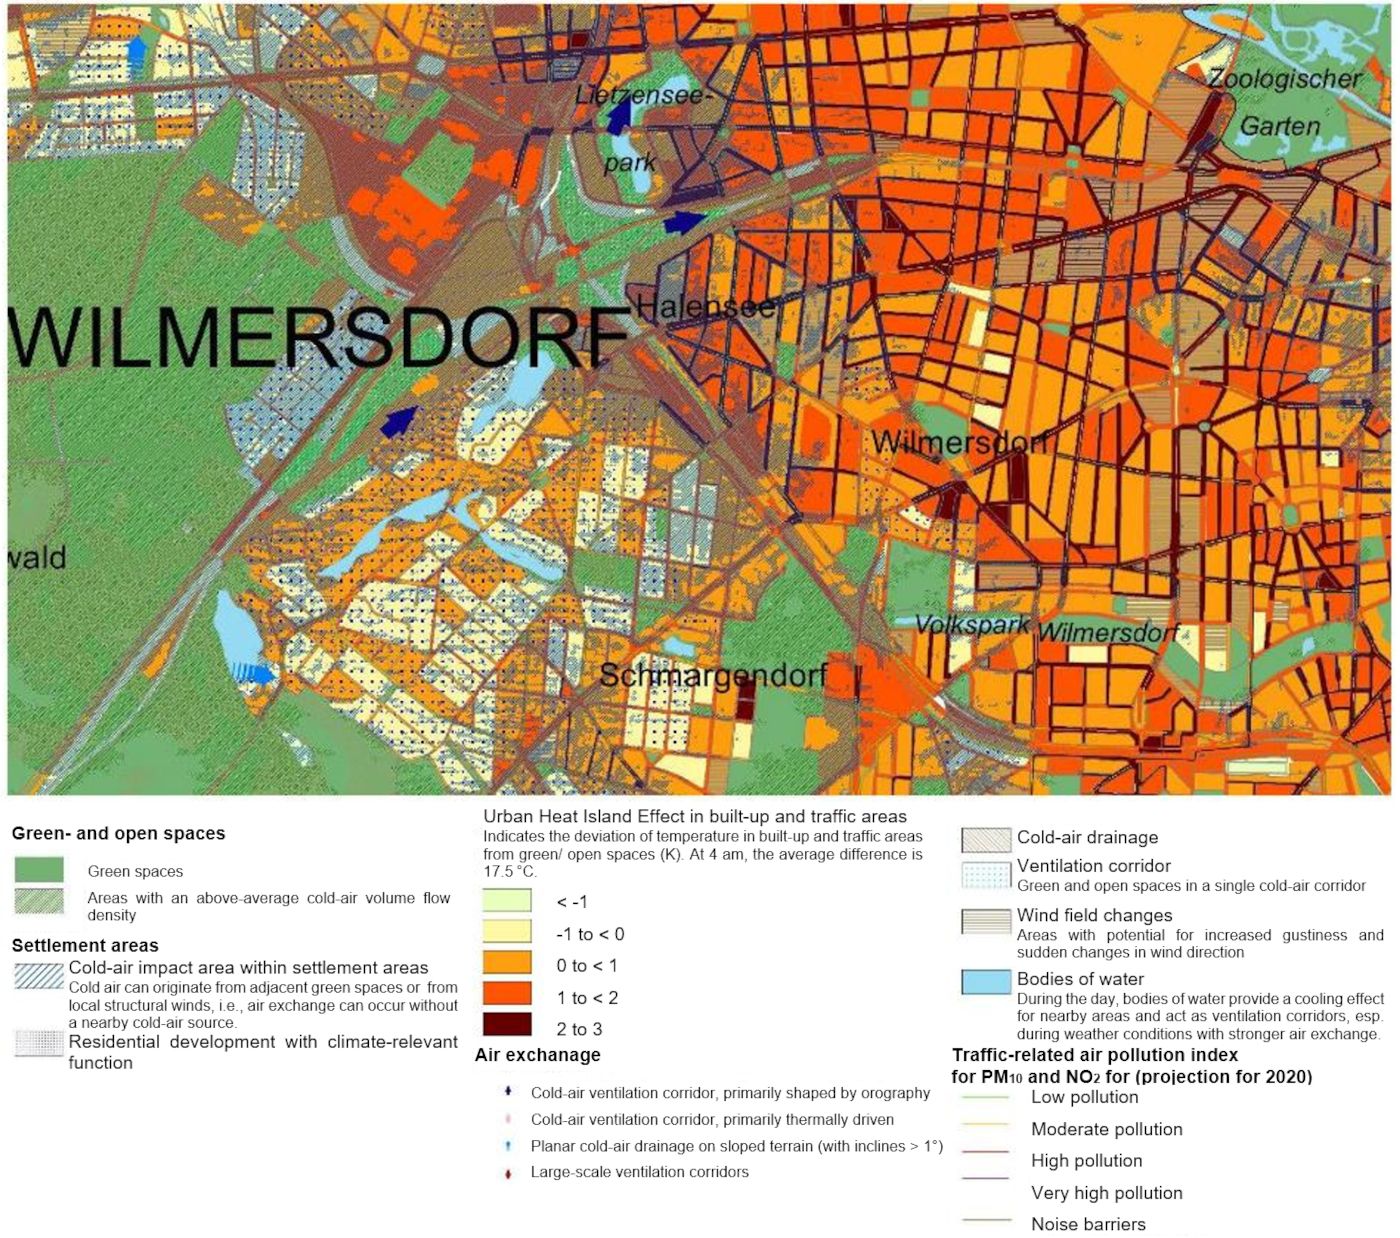
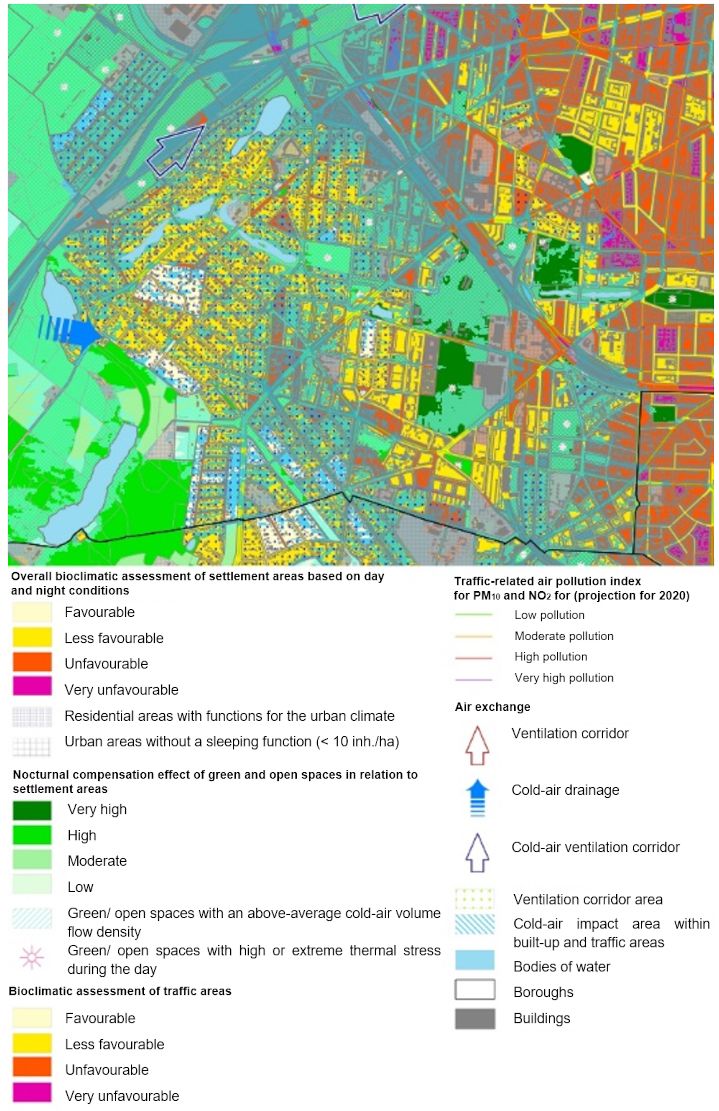
A key goal of model-based climate analysis is to capture the dynamics of near-ground air exchange processes. It also aims to connect these processes with a spatial classification of the study area into regions that are considered climatically and in terms of air quality either favourable or unfavourable. From a climatic perspective, these two categories serve to divide space into compensation areas, impact areas, and the ventilation corridors that link them. Together, they reflect an understanding of the area as an interconnected system of compensation and impact areas.
‘A compensation area is an undeveloped, vegetation-rich space that, by generating cooler and fresher air through effective air exchange, can reduce or alleviate air pollution or the bioclimatic stress in impact areas. An impact area is a burdened, built-up area, or one designated for development, that is connected to an adjacent compensation area either via air exchange processes or a ventilation corridor.’ (translated from Mosimann et al. 1999). This process marks a clear departure from the earlier more static concept based on urban climate zones (Stadtklimatope), which segmented the study area into spatial units where the essential microclimatic conditions and their effects were relatively uniform (cf. VDI 2015).
The approach taken here, using climate modelling in combination with the analysis of statistical baseline data from long-running climate stations (SenStadt 2025b), has the following important advantages:
- It ensures that results are comparable across the entire urban area.
- Beyond providing qualitative insights into individual urban climate phenomena, it enables quantitative assessments of climate and ecological conditions as well as air exchange processes.
- Areas that serve compensatory functions and processes related to climate and ecosystems are identified within the urban area and depicted as precisely as possible in terms of their spatial extent.
- Cold air dynamics, a key aspect of the potential of open spaces to provide compensatory functions for climate and ecosystems, can only be comprehensively assessed in this way.
This application of the climate model reaffirms the well-established connection between local climate conditions and the structure of buildings, open spaces, and vegetation in different parts of the city. However, climate at the local scale is shaped not only by the immediate urban structure, but also by a site’s position within the broader urban context. Different parts of the city can influence one another and interact with surrounding regions. Temperature contrasts between neighbouring areas are essential for climate-related air exchange. When these contrasts are diminished, due to increased building density or the homogenisation of urban structures, the overall urban climate deteriorates.
Meteorological Parameters
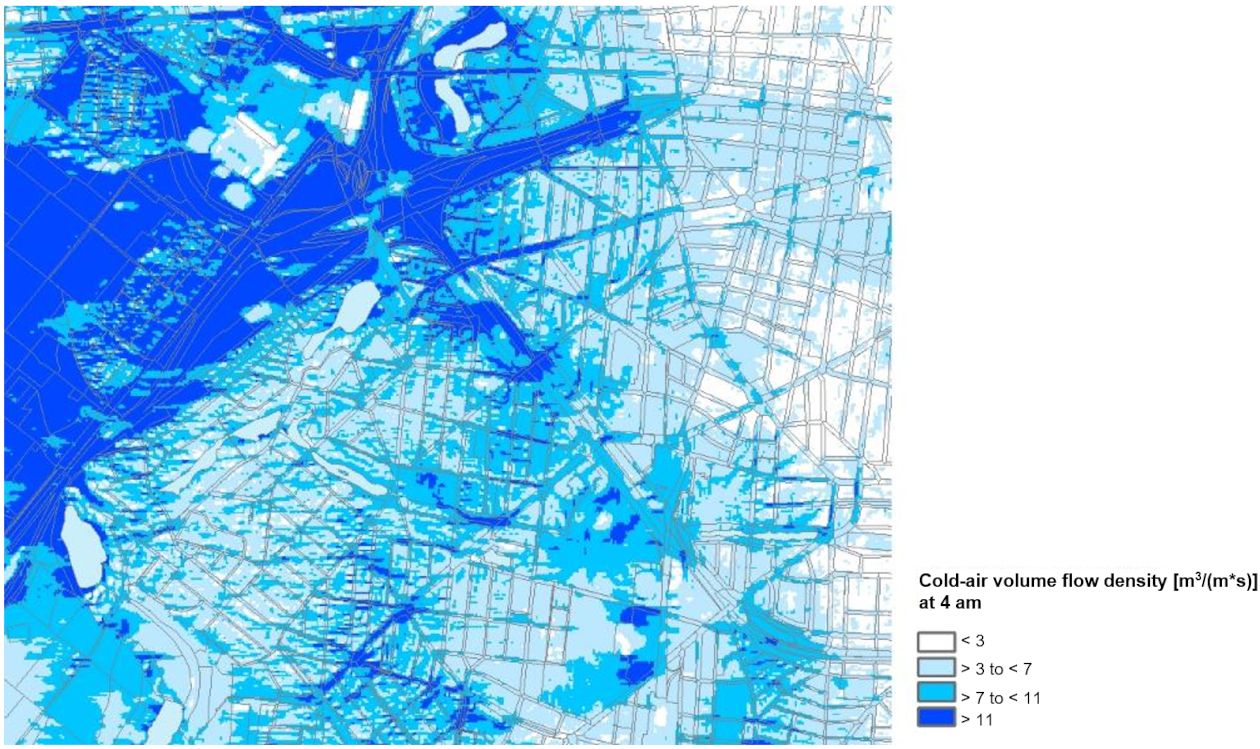
Map 04.10.1 Near-Ground Wind Field and Cold-Air Volume Flow Density (10 pm and 4 am)
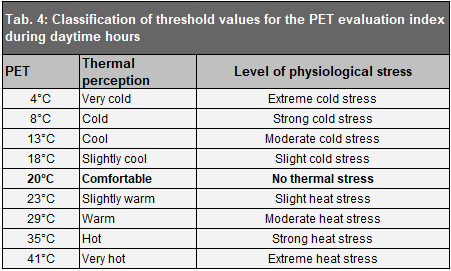
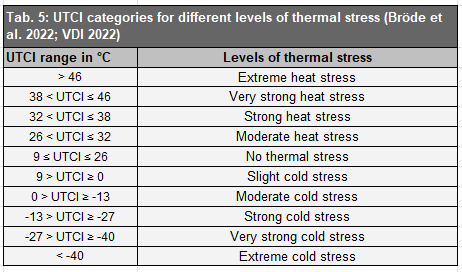
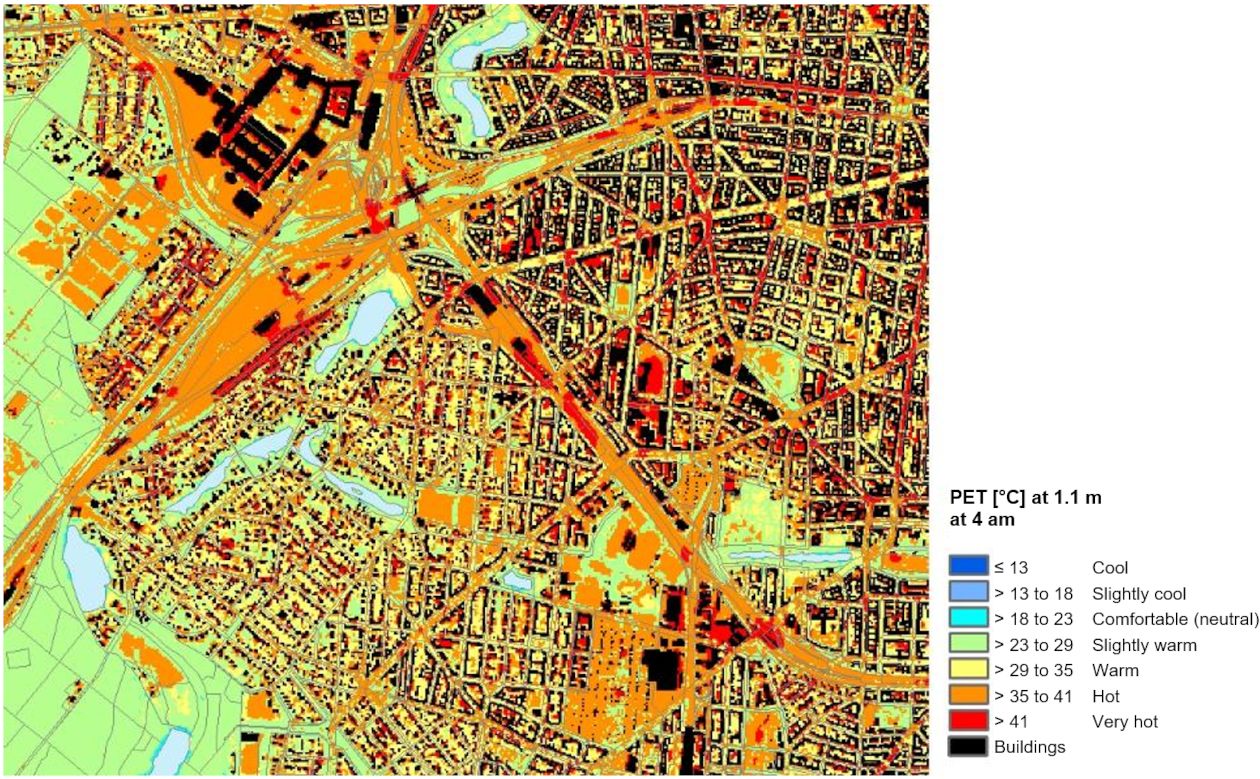
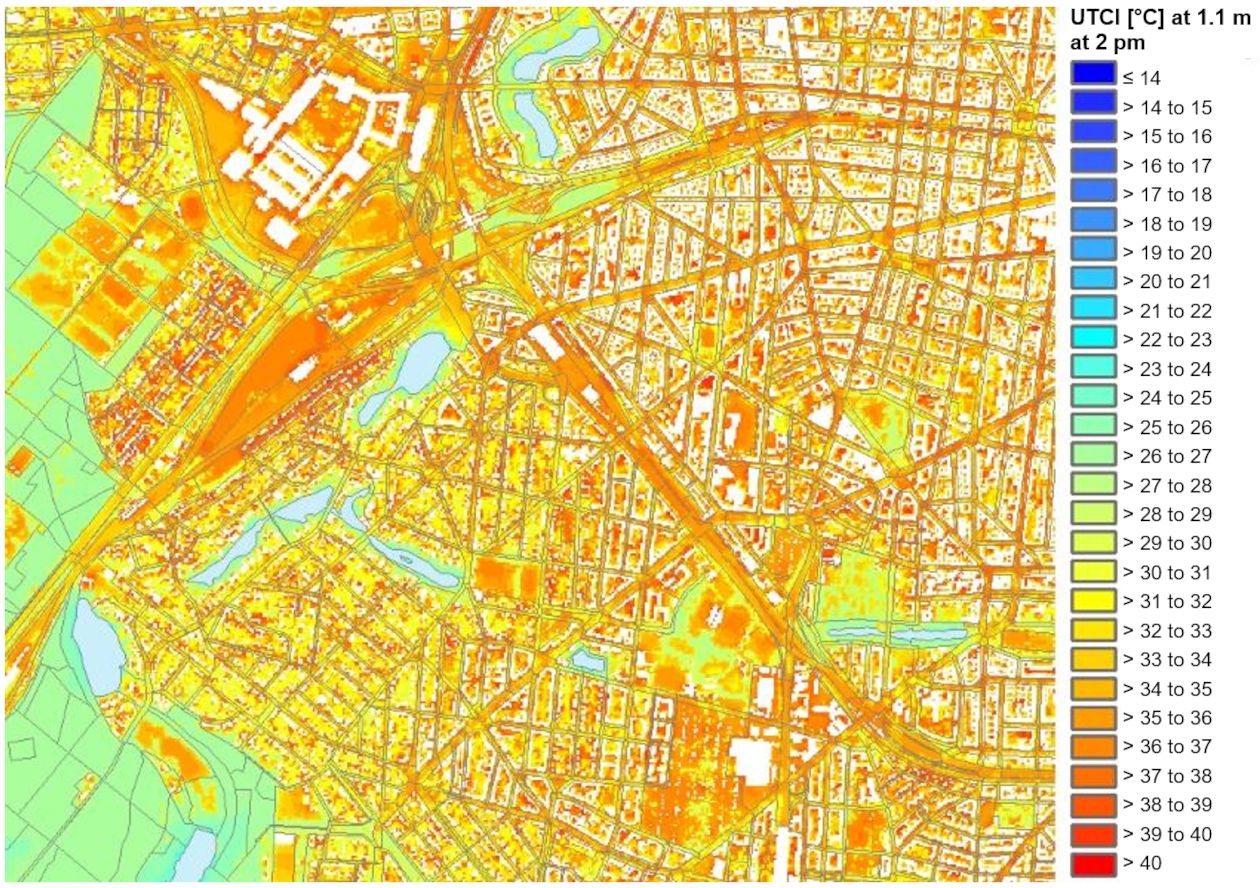
The ‘near-ground wind field’ and the ‘cold-air volume flow density’ support effective ventilation in settlement areas, which can help reduce human-biometeorological stress (cf. Moriske and Turowski 2002). These stress levels are evaluated during the day using PET (Physiological Equivalent Temperature) (see Map 04.10.5), and at night based on air temperature (cf. Map 04.11, Planning Advice Urban Climate 2022).
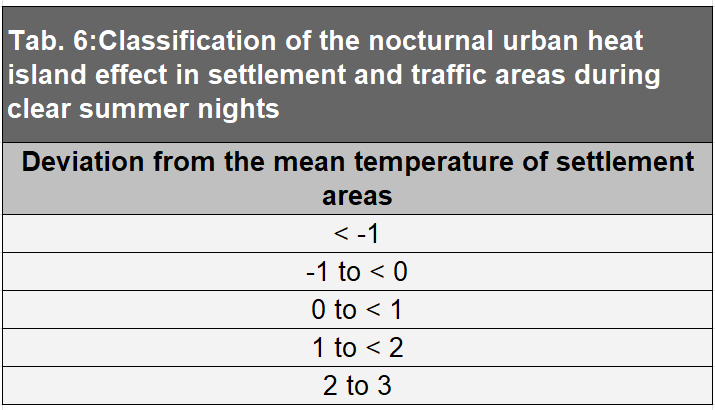
At night, cooler air flowing in from surrounding areas can reduce urban temperatures and therefore ease heat stress for humans during the summer months. If this incoming air is free of pollutants (i.e., fresh air), ventilation also improves overall air quality.
The gridded map layers represent near-ground cold-air flow at a height of 2 metres and a spatial resolution of 10 m x 10 m, based on the modelled data for 10 pm and 4 am. The wind field is depicted using vectors, where arrow direction indicates flow direction and arrow length represents wind speed, for all model grid cells with a climate-relevant minimum speed of 0.1 m/s or more. This grid-based data is complemented by area-based values showing cold-air volume flow density, expressed in m³/s.
Key Content of the Map
Effectively assessing urban ventilation conditions requires the appropriate assignment of burdened and compensation areas, the latter providing unpolluted air, and an airflow system capable of transporting air masses.
Burdened Areas
Burdened areas refer to settlement and traffic areas that experience thermal stress during the day and/or night. These are typically densely built-up urban structure types, which are also often characterised by inadequate ventilation. At night, absolute air temperature is the relevant meteorological parameter; during the day, thermal stress is assessed using Physiological Equivalent Temperature (PET).
Compensation Areas
Any undeveloped area without impervious cover has the potential to provide compensatory functions that support climate and ecosystems, both within the city and also in its surrounding areas. Whether this potential can be realised depends on local conditions, including area size, vegetation structure, location within the urban area, and the built-up environment.
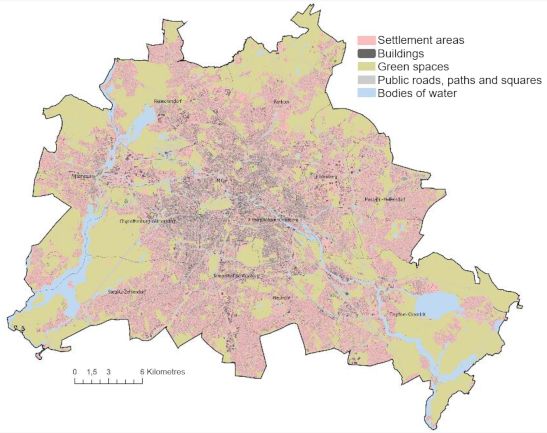
Compared to other metropoles, Berlin still has a relatively large number of inner-city open spaces, a real asset in a city with little topographical variation. Here, thermally driven air circulation is the primary means of balancing the urban climate in the city centre, which depends on the close spatial proximity of green spaces and built-up areas (cf. Map 04.11, Planning Advice Urban Climate 2022).
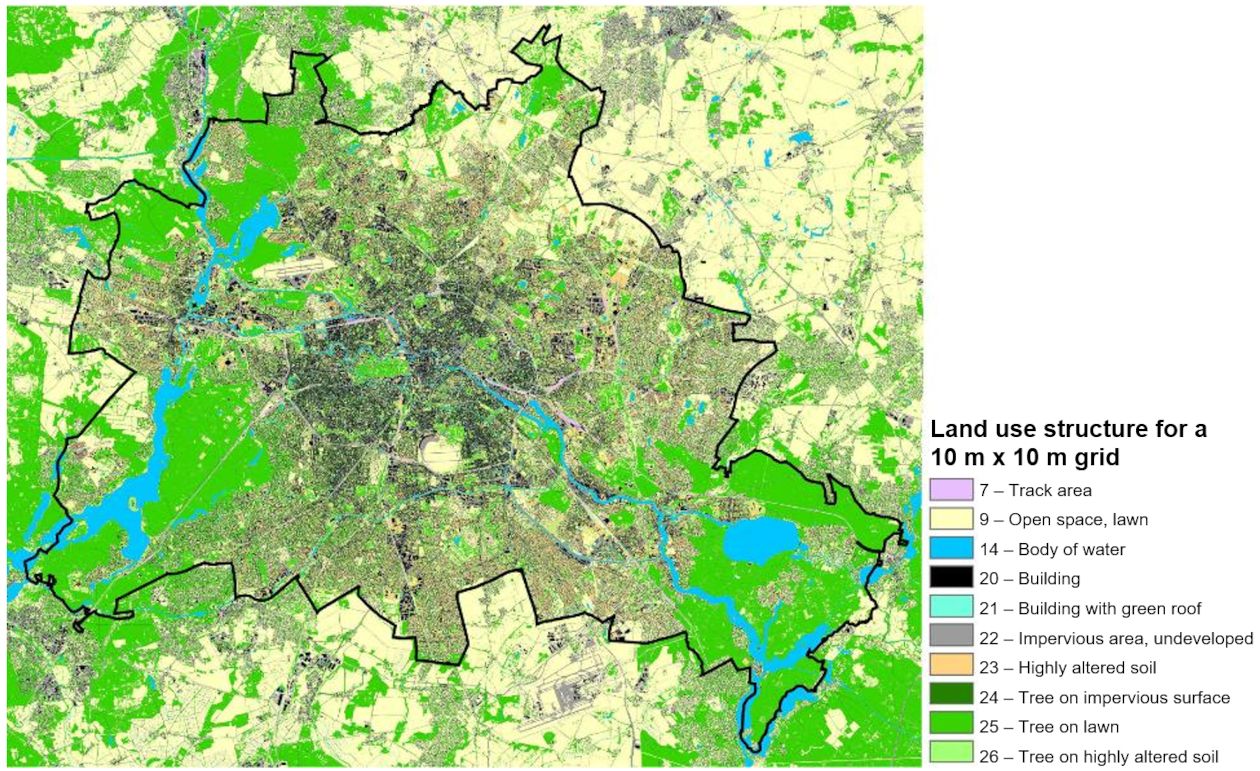
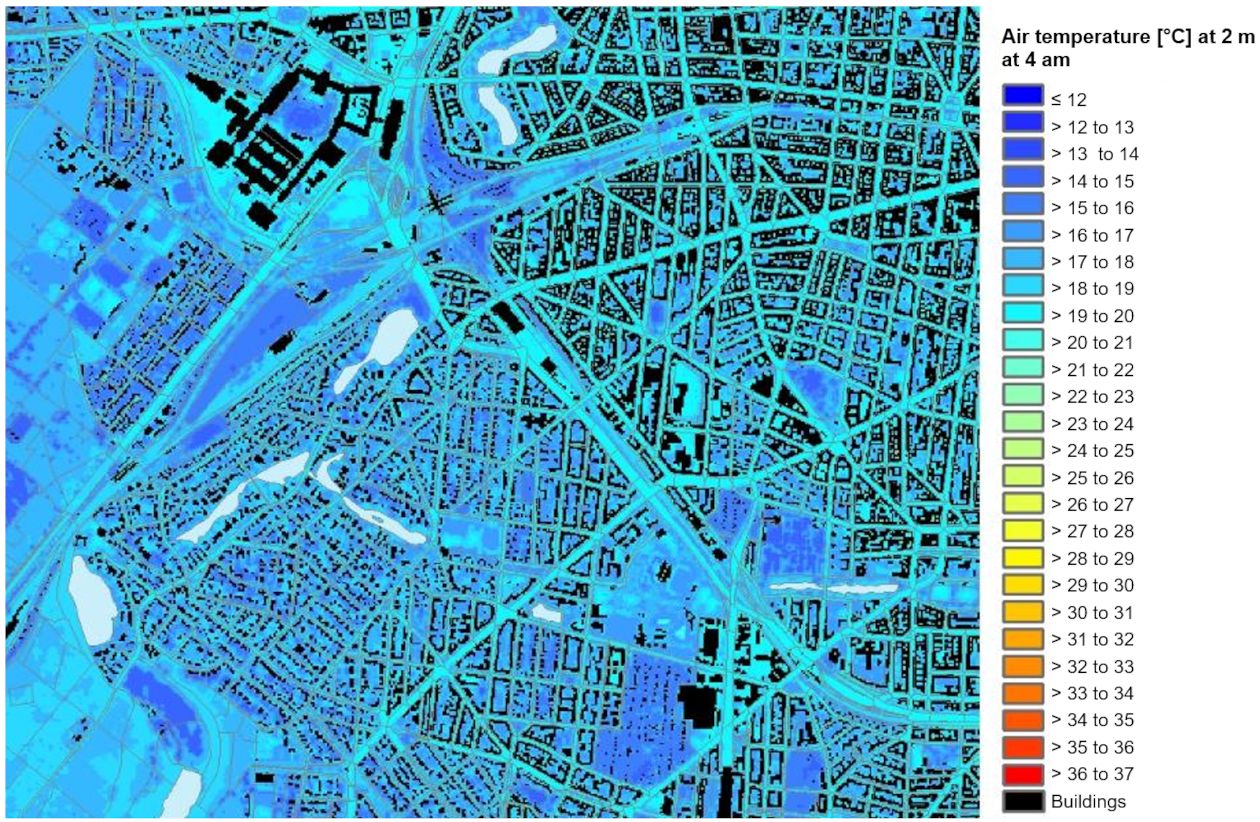
The map’s near-ground temperature field represents the gridded mean of air temperatures in the lowest part of the atmosphere (0 to 5 metres above ground). If a single grid cell includes multiple land uses of varying proportions, the displayed temperature reflects a proportional weighted mean. That means the modelled temperatures are only directly comparable to actual near-ground measurements in larger areas with either uniform or corresponding land use.
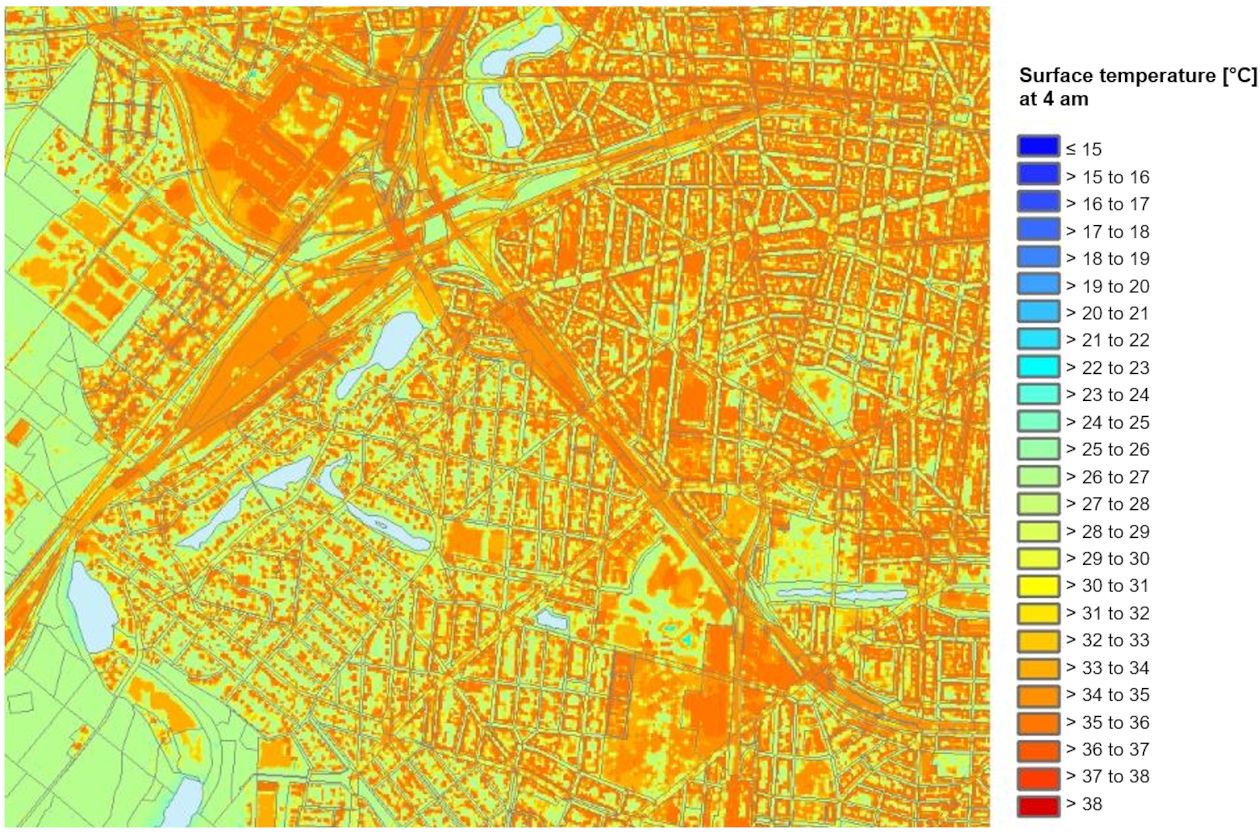
Temperature patterns are shaped by land-use-specific soil and surface properties, and their interaction with atmospheric processes in the surface boundary layer. Within the soil, heat and thermal conductivity are key: for example, the higher the soil’s heat conductivity, the more quickly and deeply heat can penetrate the material, and also be released again.
Surface properties of natural and artificial areas, such as albedo (reflectivity) and emissivity determine how much energy is available to heat or cool the environment in both the shortwave and longwave ranges of radiation. Additionally, turbulence conditions in the near-ground atmosphere significantly affect the sensible and latent fluxes between the ground surface and the air, in both directions. All of these processes are interrelated and part of the surface energy balance. They determine both the temperature of the surface and of the air layers above. As such, air temperature remains a key parameter in assessing urban overheating at night and the formation of air exchange processes.
Cold-Air Flow
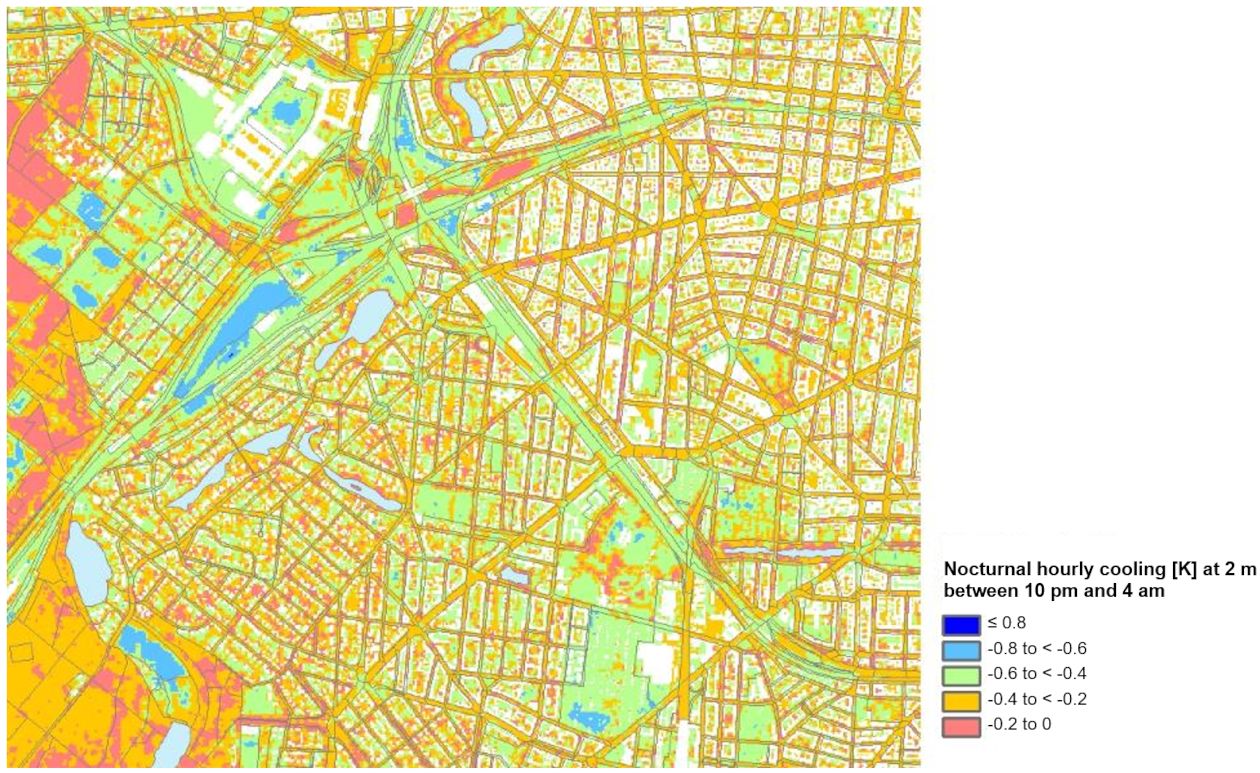
Depending on the distribution of near-ground temperatures, horizontal differences in air pressure arise, which in turn trigger local thermally induced wind systems. This process begins with the temperature contrasts that develop overnight between settlement areas and open, vegetation-rich spaces. At night, the now cooler and therefore denser air begins to flow downslope toward the lowest points in the terrain. This results in nocturnal cold-air drainage flows (e.g., Mosimann et al. 1999) that form at these slopes. The speed of this small-scale phenomenon is primarily determined by the temperature difference relative to the surrounding air and the steepness of the slope.
In addition to orographically induced flows involving cold-air drainage, thermally induced inflow winds (Flurwinde) and winds shaped by urban structures (Strukturwinde) may also develop. These provide direct thermal compensation by flowing from areas of higher to lower air pressure. They occur when heavily built-up or impervious areas heat up more than surrounding open spaces, creating a thermal low over urban areas. The resulting pressure gradient can then be offset by the inflow of cooler air masses from the surrounding areas (e.g., Kiese et al. 1992). For these flows to fully develop, air must be able to accelerate over a certain distance without being slowed by obstacles such as buildings. Both types of airflow are generally weak and localised, and can be easily overridden by even light prevailing winds. Their speeds usually remain below 0.2 m/s (Mosimann et al. 1999).
These land-use-related temperature differences begin to emerge shortly after sunset and can persist throughout the night. Meadows and farmland are especially effective in producing cold air. Depending on surface characteristics and cooling rates, cold-air flows can develop rapidly. Initially, these flows are shallow, with a layer thickness of only 5 to 10 metres, and form between various surfaces that warm and cool at different rates.
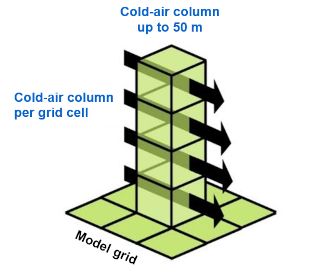
Definition of Cold-Air Volume Flow Density
Cold-air volume flow density (hereafter referred to simply as cold-air volume flow) is defined as the product of the flow velocity of the cold air and the vertical (layer thickness) and horizontal dimensions of the cross-sectional area it passes through (flow width). In other words, it quantifies the volume of cold air (in m³) that flows per second across a one-metre-wide section (see Figure 4).