The climate in the city differs from that of the surrounding environment due to changes in the soil and surface properties within the urban area. These changes often result in urban overheating and local wind patterns. The Climate section provides high-resolution spatial information on Berlin’s urban climate in this context. The underlying data is based on climate modelling conducted in 2022 using the mesoscale FITNAH-3D climate model (see Methodology). Berlin’s rapid urban development prompted an update of the key database on the city’s climate. Between 2022 and 2024, the urban climate analysis was revised, based on the building stock as of 2022. Additional data sources were required to digitally represent the settlement area (see Statistical Base) and carry out the climate modelling.
This 2022 climate modelling produced a series of map representations, titled Climate Analysis 04.10.1 to 04.10.9. Each map focuses on specific climate parameters and evaluation indices that are listed in the following. The main Climate Analysis Map summarises the key findings from the overall assessment. The individual maps are described in the Map Description section of each topic. All maps are available via the Geoportal Berlin. For illustrative purposes, the section Guide to Reading the Map in this document uses an example area to demonstrate how the urban climate can be assessed using the various thematic maps.
The Environmental Atlas maps are available in the new Map Application
04.10 Berlin Climate Modelling – Climate Analyse Maps 2022
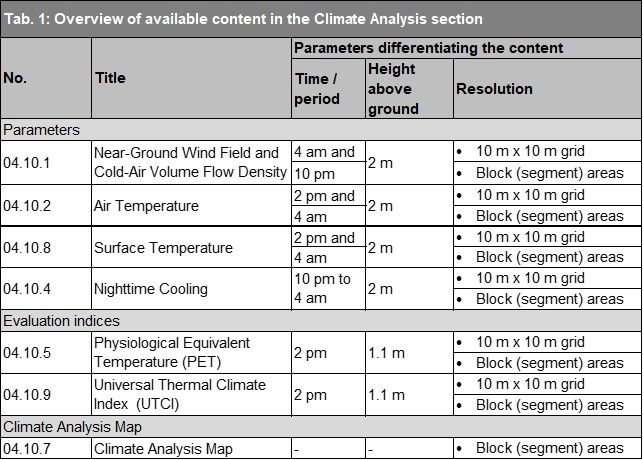
Tab. 1: Overview of available content in the Climate Analysis section
Image: Umweltatlas Berlin
Environmental Atlas Map 04.12 highlights selected meteorological threshold days, such as hot days, summer days, and tropical nights, across three timeframes: the reference period from 1971 to 2000 and future periods from 2031 to 2060 and 2071 to 2100.
For the first time, this edition also features the Universal Thermal Climate Index (UTCI) as an addition to the previously used Physiological Equivalent Temperature (PET). While the PET focuses on thermal comfort in temperate zones, the UTCI is geared more toward extreme climatic conditions and how they impact our perception of heat.
Some maps are available for various time points and periods. Additionally, the original data from the FITNAH-3D climate model is presented in a high-resolution 10 m x 10 m grid or aggregated at block (segment) area level.
Contact
Berlin Senate Department for Urban Development, Building and Housing
Mr. Dr. Brunnow
Environmental Atlas Contact
Berlin Senate Department for Urban Development, Building and Housing
Mrs. Haag