New

The Environmental Atlas maps are available in the new Map Application

Berlin Climate Modelling – Urban Climate Planning Guidelines 2022

Map Description

Map 04.11.1 Urban Climate Planning Guidelines – Overall Assessment of Daytime and Nighttime Conditions

Settlement Areas

In Berlin, around one third of the settlement area, 33.1%, is affected by heat stress caused by daytime and/or nighttime conditions. Of these, 2.6% are classified as ‘very unfavourable’. From an urban-climate perspective, proactive measures to improve the situation and a responsible approach to land use are strongly recommended. In the view of extreme weather events and climate change, this recommendation can be extended to areas rated as ‘unfavourable’. On the other hand, about 67% of Berlin’s settlement area falls into the ‘less favourable’ or ‘favourable’ classes, indicating generally lower levels of heat stress (cf. Figure 1). In these areas, it is important to ensure that construction measures do not lead to significant negative impacts, either on the area itself or on neighbouring spaces, during the day or night.

Figure 1: Percentage distribution of assessment classes for overall thermal conditions in Berlin’s settlement areas (daytime and nighttime)

Figure 1: Percentage distribution of assessment classes for overall thermal conditions in Berlin’s settlement areas (daytime and nighttime)

The main hotspots of combined daytime and nighttime thermal stress are found in the boroughs of Friedrichshain-Kreuzberg and Mitte (cf. Figures 2 and 3). In both, over 60% of the settlement areas fall into the classes of ‘less favourable’ or ‘unfavourable’, which is coupled with the recommendation to improve local conditions. The two boroughs are characterised by ‘closed block-edge development’ (area types 2 and 7) and ‘large-scale retail’ (area type 30), which together account for more than 40% of land use. As a result, these areas are highly built-up with a high degree of impervious soil coverage and rather little green space. These conditions contribute to locally elevated stress levels, particularly at night, and in some places, during the day as well.

In contrast, thermal conditions are relatively positive in the boroughs of Reinickendorf, Treptow-Köpenick, and Spandau, where less than 40% of the area requires measures to improve local conditions. On the one hand, these boroughs benefit from a high proportion of green spaces and their connection to cold-air generating zones in and around the city, such as the expansive forest areas between Müggelsee and the Dahme River in Treptow-Köpenick. On the other hand, their more open, historically rooted development structure contributes to a generally lower level of thermal stress. Across all three boroughs, ‘detached single-family homes with yards’ (area type 23) make up the largest proportion of land use, with almost 50% in Marzahn-Hellersdorf.

These area types, along with other green housing typologies such as ‘row houses and duplexes with yards’ (area type 22), ‘detached single-family homes with yards’ (area type 23), and ‘villas and town villas with park-like gardens’ (type 24) are grouped under the category ‘residential areas with climate-regulating functions’ and are highlighted separately in the PHK. Thanks to their high proportion of green spaces, these areas play a key role in nighttime cooling across Berlin’s urban area. Their function is especially important within the settlement area, as they help preserve local cold-air flows.

The map also identifies areas without overnight use. These are regions with fewer than 10 inhabitants per hectare, which are assumed not to be used for residential purposes. Measures to reduce heat stress, especially during the day, are important here. These can include green façades, green roofs or shaded outdoor spaces to improve comfort in public areas.

Figure 2: Spatial distribution of assessment classes for overall thermal conditions in Berlin’s settlement areas (daytime and nighttime)

Figure 2: Spatial distribution of assessment classes for overall thermal conditions in Berlin’s settlement areas (daytime and nighttime)

Figure 3: Breakdown of overall thermal conditions in the settlement areas of Berlin’s 12 boroughs and the city as a whole

Figure 3: Breakdown of overall thermal conditions in the settlement areas of Berlin’s 12 boroughs and the city as a whole

Traffic Areas

Around 62% of Berlin’s traffic areas fall into the two highest thermal stress classes (cf. Figure 4). For road sections and squares categorised as ‘very unfavourable’, it is recommended that measures to improve thermal conditions be implemented in the short term. These should target daytime conditions, with a particular focus on creating shade. Where these traffic areas directly border settlement areas that also experience thermal stress at night, additional measures, especially those that reduce heat retention, are advisable. Special attention should also be paid to sections where unfavourable thermal conditions were modelled and elevated or very high levels of traffic-related air pollution have been identified.

In the medium term, measures are also recommended for sub-areas that fall into the ‘less favourable’ class. During heatwaves, they can experience significantly higher thermal stress levels than those simulated. In addition, climate change is expected to gradually increase thermal stress levels experienced in public traffic areas during an average summer day.

Figure 4: Percentage distribution of assessment classes for overall thermal conditions in traffic areas

Figure 4: Percentage distribution of assessment classes for overall thermal conditions in traffic areas

Thermal conditions in the remaining 4.5% of the area within the spatial unit are currently classified as ‘favourable’. While measures for further improvement are not strictly necessary here, they should be considered if adjacent settlement areas experience thermal stress and if measures in those areas cannot be implemented or are insufficient.

Figure 5: Overall bioclimatic assessment of traffic areas

Figure 5: Overall bioclimatic assessment of traffic areas

Figure 6: Breakdown of overall thermal conditions in the traffic areas of Berlin’s 12 boroughs and the city as a whole

Figure 6: Breakdown of overall thermal conditions in the traffic areas of Berlin’s 12 boroughs and the city as a whole

Air Exchange

Three main elements contribute to Berlin’s urban ventilation:

  • airflow and ventilation paths,
  • orographically and thermally induced extensive cold-air drainage, and
  • thermally induced linear cold-air flow paths.

The city’s primary airflow and ventilation paths follow the river valleys of the Havel, Dahme, and Spree. They are especially relevant during externally driven weather conditions with stronger winds, when regional wind systems form due to air pressure differences of varying spatial extent. Under such conditions, westerly winds generally dominate. In the valleys, incoming cold air is channelled, accelerated and transported into the typically less windy urban core, creating a ‘jetting flow’. To take full advantage of this process, construction in transitional areas near bodies of water should remain open and unobstructed and shorelines should be kept clear.

Locally driven weather patterns, with little or no influence from large-scale wind systems, are less common in Berlin (occurring on about 25% of summer nights between 1991 and 2020 at the Tegel measurement station; SenStadt 2024). These conditions are often associated with greater stress on public health, however, as temperature inversions inhibit the dispersion of air pollutants and contribute to the urban heat island effect. Under such circumstances, thermally and/or orographically induced cold-air drainage and thermally induced inflow systems (Flurwindsysteme) provide the city with cold, fresh air.

Thermally and orographically induced cold-air drainage occurs due to variations in the terrain, causing cooler air to flow downhill along the slopes during the early morning hours. For this drainage to be relevant in urban planning, there needs to be a broad slope of more than 1% that is oriented toward a settlement area experiencing heat stress. In terms of surface area, the Grunewald forest offers the greatest potential for cold-air drainage, which particularly benefits the neighbouring residential areas to the north and east.

In contrast, cold-air flow paths that are purely thermally induced occur more frequently and are more evenly distributed across the city. They result from rapidly alternating high- and low-pressure systems that develop at night as part of locally driven weather patterns. They ensure that the air rising above warm, densely built-up settlement areas is replaced close to the ground by cooler air from its surroundings, primarily larger green and open spaces. This process is the main source of thermal relief, especially in the city centre.

Due to spatial overlap, it is difficult to clearly delineate the influence zones of individual cold-air flow paths, whether in relation to each other or to other elements contributing to Berlin’s urban ventilation. This would require further modelling and measurement-based analyses. However, the model results can be used to approximate core areas of individual airflow paths and thus enable a rough quantification and comparison. Green corridors are particularly suitable as core areas for thermally induced airflow paths. They not only transport cold air from adjacent areas into the urban environment but also add internally generated cold air to the airflow. Wide roads can also transport cold air into the city effectively. It is important here, however, to distinguish between paths that channel clean air and polluted air (VDI 2015).

Airflow paths and their ventilation corridors were determined manually as part of an expert assessment, referring to the dimensions of the locally induced airflow field simulated by the FITNAH model. The thus defined boundaries are not spatially precise and typically require further expert assessment in site-specific planning contexts (e.g. for development projects).

A total of 23 airflow paths were identified in the Berlin urban area (cf. Figure 7). Their core areas cover around 2,206 hectares, which corresponds to about 2.5% of the city’s total area. Each airflow path constitutes a central element of Berlin’s urban ventilation. Any building development that could potentially obstruct the flow of cold air should therefore be avoided. In general, the preservation of green and open spaces should be prioritised in these areas. Where development is necessary, building heights should be kept as low as possible, and new structures should be oriented parallel to the direction of airflow. Block-edge development should be avoided entirely.

Figure 7: Core areas of cold-air flow paths (‘ventilation corridors’) in Berlin

Figure 7: Core areas of cold-air flow paths (‘ventilation corridors’) in Berlin

For all three main elements contributing to Berlin’s urban ventilation, it is equally true that their individual structures (airflow and ventilation paths), potential areas (cold-air drainage) and core areas (cold-air flow paths) can be derived from a combination of model results and additional factual data and geodata. It is not possible, however, to precisely delineate their influence zones – which often extend far beyond the areas described above – or to clearly assign them to specific elements, as there is considerable spatial overlap and interaction.

It is possible, however, to map and quantify the combined cold-air influence zone that contributes to the city’s urban ventilation resulting from the individual processes (cf. Figure 8). This analysis also includes cold air generated by the numerous green spaces of varying sizes and densely vegetated settlement areas. These local phenomena are the smallest pieces in the mosaic of Berlin’s urban ventilation and provide important climatic and environmental benefits, particularly in sub-areas that are not directly connected to cold-air flow paths or cold-air drainage, such as the boroughs of Mitte and Friedrichshain-Kreuzberg.

Figure 8: Cold-air influence zones of the elements contributing to Berlin’s urban ventilation under locally driven weather conditions

Figure 8: Cold-air influence zones of the elements contributing to Berlin’s urban ventilation under locally driven weather conditions

As Figure 9 illustrates, there are significant differences between Berlin’s boroughs in both the absolute and relative shares of residents benefiting from cold air, as well as the extent of the affected settlement area. In all categories, Reinickendorf, Pankow, and Spandau consistently rank among the top three, benefiting most from Berlin’s urban ventilation. Reinickendorf stands out in particular: about 45% of its settlement area is connected to cold-air flows, while only 24% experiences heat stress with ‘unfavourable’ or ‘very unfavourable’ conditions. It can be assumed that the notably low heat stress at night, and especially the very small proportion of building blocks with ‘unfavourable thermal conditions’ in these boroughs is closely linked to their good supply of cold air. Conversely, the boroughs of Tempelhof-Schöneberg and especially Mitte show the opposite trend. Cold air influences a mere 15.3% and 16.2% of their urban areas, respectively, while heat stress affects a substantial 44.0% and 64.2%. Across Berlin as a whole, model results suggest that approximately 35% of built-up areas benefit from cold air, either transported into the city through complex air exchange processes or generated locally.

On the one hand, these figures highlight the central importance of cold-air dynamics for Berlin. On the other hand, they also reveal potential for improvement to be unlocked through the implementation of appropriate measures.

Figure 9: Breakdown of the impact of cold air on Berlin’s settlement areas by borough

Figure 9: Breakdown of the impact of cold air on Berlin’s settlement areas by borough

Green and Open Spaces

About 22% of Berlin’s green and open spaces fall into the ‘highest’ protection category (cf. Figures 10 and 11). These spaces include ‘compensation areas’ which are of crucial importance for today’s urban structure, as they have a climate-regulating and ecosystem-balancing effect. Because of their critical climate functions, development in these areas should generally be avoided. Where development is already zoned under the land-use plan (FNP-Bauflächen), it should only move forward with close attention to preserving these vital functions. To maximise their ecosystem services, planning should aim to maintain good airflow through surrounding built-up areas, establish and strengthen connections to nearby green and open spaces, and, where possible, increase microclimatic diversity. In addition to the entirety of inner-city green and open spaces such as the Park am Gleisdreieck, Tempelhofer Feld, and the Großer Tiergarten, some farmland in the north of Berlin also falls into the highest protection category. The green corridors that lie within cold-air flow paths are especially important, as they play a vital role in ventilating the urban environment.

In total, around 54% of Berlin’s green and open spaces are considered to have a ‘high’ need for protection. The largest proportion, about 77%, consists of the city’s extensive forest areas. The remaining proportion is made up primarily of parks, allotment gardens, and vegetated fallow areas.

These spaces serve as compensation areas, which are of crucial importance for today’s urban structure, as they have a climate-regulating and ecosystem-balancing effect. Construction should be carefully limited. Where development is already zoned under the land-use plan it should only move forward with close attention to preserving these vital functions. To maximise their ecosystem services, planning should aim to maintain good airflow through surrounding built-up areas, establish and strengthen connections to nearby green and open spaces, and, where possible, increase microclimatic diversity.

About 76% of Berlin’s green and open spaces are rated as having ‘high’ or ‘very high’ climate and ecological protection needs. This underscores the monumental role these areas play in maintaining a healthy urban climate.

Areas with ‘medium’ protection needs play a secondary role in the city’s climate regulation system, typically generating cold air at a greater distance from heat-stressed settlement areas. They account for only a small proportion of the total area unit. Although surrounding built-up areas may benefit from their climate functions, they are generally not reliant on them. The remaining areas are considered to have a ‘low’ protection level. Their positive contribution to the urban climate and the ecosystem, if any, is considered negligible. If an area in the ‘low’ or ‘moderate’ protection class, or its immediate surroundings undergoes development, its protection needs should be reassessed.

Figure 10: Percentage distribution of assessment classes for the climate and ecological protection of Berlin’s green and open spaces

Figure 10: Percentage distribution of assessment classes for the climate and ecological protection of Berlin’s green and open spaces

Figure 11: Spatial distribution of assessment classes for the climate and ecological protection of Berlin’s green and open spaces

Figure 11: Spatial distribution of assessment classes for the climate and ecological protection of Berlin’s green and open spaces

Map 04.11.1.1 Planning Guidelines – Daytime

Daytime conditions are assessed at 2 pm using the Physiological Equivalent Temperature (PET), an index that reflects human thermal perception. VDI Guideline 3787, Part 2 (VDI 2022) provides an absolute scale for interpreting PET values, quantifying both thermal perception and levels of physiological stress (cf. Table 1). In the evaluation map, thermal stress in settlement areas and the comfort levels of green and open spaces are classified based on these levels of physiological stress. High thermal comfort occurs under slight or no heat stress, while strong or extreme heat stress results in low or very low comfort. The daytime bioclimatic assessment measures comfort levels in settlement areas outside of buildings, as well as in green and open spaces. While outdoor conditions can influence indoor environments, indoor climates also depend on many other factors, such as building-specific characteristics. A detailed analysis of these interactions lies beyond the scope of this study.

Table 1: Classification of threshold values for the PET evaluation index during daytime hours (according to VDI 2022)

Table 1: Classification of threshold values for the PET evaluation index during daytime hours (according to VDI 2022)

Settlement and Traffic Areas

Figure 12 illustrates that almost 65% of settlement areas exhibit high levels of bioclimatic stress, with 2.8% experiencing extreme stress. These are mostly commercial areas characterised by large impervious (sealed) surfaces, few green spaces and low-rise buildings, which leads to intense solar radiation and thermal stress during the day. Notable examples include parts of Pankow, Marzahn-Hellersdorf, and Treptow-Köpenick (cf. Figure 13). In greener settlement types, heat stress also varies depending on the degree of tree cover. Around the Grunewald forest, for instance, settlement types with private yards or villas with park-like gardens generally experience moderate heat stress. Citywide, these settlement types account for about 30.3% of the total area. By contrast, the detached single-family homes with yards situated along Blumberger Damm in Marzahn-Hellersdorf are characterised by fewer trees and less shade. As a result, these areas typically experience strong heat stress during the day, but more intense cooling at night. This leads to a greater temperature range over the course of the day compared to the surroundings of the Grunewald area.

Areas with only mild heat stress are rare, covering just 2.0% of the city, and are mostly found on the outskirts where a higher proportion of vegetation provides shade.

Figure 12: Percentage distribution of assessment classes for bioclimatic conditions in Berlin’s settlement areas (daytime)

Figure 12: Percentage distribution of assessment classes for bioclimatic conditions in Berlin’s settlement areas (daytime)

Figure 13: Spatial distribution of assessment classes for bioclimatic conditions in Berlin’s settlement areas (daytime)

Figure 13: Spatial distribution of assessment classes for bioclimatic conditions in Berlin’s settlement areas (daytime)

As traffic areas are almost completely paved or otherwise impervious, they are also widely affected by thermal stress. These spaces exhibit a broad range of structural characteristics – from open, fully paved squares to road sections with ample shade provided by trees or buildings. The proportion of areas experiencing extreme heat stress is significantly higher at 5.8% compared to the settlement areas (cf. Figure 14). Notably, traffic areas experiencing low thermal stress account for 4.5%, which is more than twice the proportion found in settlement areas. High stress affects 56.5% of traffic areas, while moderate stress occurs in 33.7%. Overall, the distribution mirrors that of settlement areas.

Figure 14: Percentage distribution of assessment classes for bioclimatic conditions in Berlin’s traffic areas (daytime)

Figure 14: Percentage distribution of assessment classes for bioclimatic conditions in Berlin’s traffic areas (daytime)

Figure 15: Spatial distribution of assessment classes for bioclimatic conditions in Berlin’s traffic areas (daytime)

Figure 15: Spatial distribution of assessment classes for bioclimatic conditions in Berlin’s traffic areas (daytime)

Green and Open Spaces

Around 58% of Berlin’s green spaces offer high comfort levels, with correspondingly low PET values, making them relatively pleasant places to spend time during hot summer days. Depending on their location, they can serve as potential spaces to escape the heat and recreational spots for the population (cf. Figure 16). Typically, such spaces are forests or parks with dense tree cover, such as the Großer Tiergarten or Volkspark Friedrichshain. Another 16.8% of green spaces offer moderate comfort; here, fewer trees result in greater overall sun exposure. Altogether, three-quarters of Berlin’s green spaces offer good thermal comfort. The remaining areas, largely exposed to strong solar radiation and therefore offering little opportunity for retreat, account for 23.9% of green spaces with low thermal comfort and 1.1% with very low comfort. This latter category also includes areas used for agricultural purposes within the city.

Figure 16: Percentage distribution of assessment classes for bioclimatic conditions in Berlin’s green and open spaces (daytime)

Figure 16: Percentage distribution of assessment classes for bioclimatic conditions in Berlin’s green and open spaces (daytime)

Figure 17: Spatial distribution of assessment classes for bioclimatic conditions in Berlin’s green and open spaces (daytime)

Figure 17: Spatial distribution of assessment classes for bioclimatic conditions in Berlin’s green and open spaces (daytime)

Map 04.11.1.2 Planning Guidelines – Nighttime

A restful night’s sleep depends on favourable thermal conditions, making nighttime heat stress particularly significant. Since indoor temperatures in apartments at night can only be influenced through air exchange, the temperature of the outdoor air plays a crucial role in assessing human thermal strain. Consequently, assessments of bioclimatic conditions focus less on outdoor heat stress and more on how nighttime indoor environments can be positively influenced.

Settlement and Traffic Areas

At the block level, bioclimatic conditions are assessed based on nighttime air temperature and presented as an average across each area (cf. Figures 18 and 19). This results in a spatial differentiation of the settlement area into zones subject to thermal stress and those that are either unaffected or only mildly affected. These more favourable areas tend to experience only slight overheating, either because they lie within the influence zones of nearby green spaces that generate cool air, or because a high proportion of vegetation enables strong internal cooling.

They stand in contrast to areas marked by above-average heat stress and poor ventilation, especially in the boroughs of Mitte, Charlottenburg-Wilmersdorf, and Friedrichshain-Kreuzberg. Similarly unfavourable or even very unfavourable bioclimatic conditions are also found in neighbourhood centres and larger commercial areas across other parts of the city. These are mainly due to high building density, extensive impervious soil coverage, and, in some cases, poor ventilation conditions. Settlement and traffic areas show a similar spatial pattern, with most of the stressed zones concentrated in the inner city or along the Ringbahn circle line.

Figures 20 and 21 provide an overview of the spatial distribution. Compared to daytime conditions, the proportion of areas subject to thermal stress at night differs significantly between settlement and traffic areas. Around 77% of settlement areas benefit from favourable nighttime conditions with only mild overheating, while in traffic areas this proportion drops to a mere 21%. This difference is largely due to the presence of green spaces in settlement areas, which contribute to reducing surrounding temperatures. Such green spaces are rare in traffic areas, where thermal relief is typically limited to roadside greenery or fallow areas.

Figure 18: Spatial distribution of assessment classes for bioclimatic conditions in Berlin’s settlement areas (nighttime)

Figure 18: Spatial distribution of assessment classes for bioclimatic conditions in Berlin’s settlement areas (nighttime)

Figure 19: Spatial distribution of assessment classes for bioclimatic conditions in Berlin’s traffic areas (nighttime)

Figure 19: Spatial distribution of assessment classes for bioclimatic conditions in Berlin’s traffic areas (nighttime)

Figure 20: Percentage distribution of assessment classes for the bioclimatic conditions of Berlin’s settlement areas (nighttime)

Figure 20: Percentage distribution of assessment classes for the bioclimatic conditions of Berlin’s settlement areas (nighttime)

Figure 21: Percentage distribution of assessment classes for bioclimatic conditions in Berlin’s traffic areas (nighttime)

Figure 21: Percentage distribution of assessment classes for bioclimatic conditions in Berlin’s traffic areas (nighttime)

Green and Open Spaces

Cold air that forms in open spaces during clear nights only becomes relevant for urban planning if those spaces are connected to built-up areas that can benefit from their compensatory function. The cooling function of green spaces is assessed specifically with regard to its importance for human comfort in nearby settlement areas. In other words, green spaces that currently do not serve the surrounding settlement areas or are not designated as compensation areas are rated as ‘low’ importance. However, if further development occurs in or around these areas, their role may shift and their the rating would need to be reassessed.

Green and open spaces are evaluated using a semi-automated process. Their climatic importance thus derived is based on two main factors: the location of the green or open space in relation to thermally stressed urban areas, and its internal climate parameters, particularly its ability to generate cold air. This distinction is vital because internal climatic parameters are not equally effective across all aspects. For example, even a green space with relatively low cold-air production can still significantly reduce high thermal stress in an otherwise densely built-up area. For this reason, open spaces near residential areas suffering from nighttime overheating and poor bioclimatic conditions are generally recognised as highly important. Green spaces with ‘very high’ climatic importance are located directly adjacent to areas experiencing high levels of thermal stress.

Green spaces classified as ‘high’ either have an impact area nearby that experiences moderate overheating and less favourable bioclimatic conditions, or they demonstrate above-average cold-air production and are designated as compensation areas or sources of cold air. This evaluation forms an integral part of PHK main map 04.11.1, with their spatial distribution shown in Figure 11.

Map 04.11.2 Supplementary Planning Guidelines

Areas Particularly Affected by Urban Climate Impacts

For block (segment) areas located within settlement or traffic areas with ‘less favourable’ – and especially ‘unfavourable’ – conditions, the implementation of measures is recommended. In addition, there is potential to improve the ecosystem services of a few open and green spaces that are vital in balancing the climate, particularly in relation to human comfort levels. Areas particularly affected by urban climate impacts are those parts of the urban fabric that are subject to particularly high levels of stress, signalling an urgent need for action. This could involve strategies such as urban regeneration or redevelopment.

To offer more tailored guidance for the three spatial units shown on the main map (settlement areas, green and open spaces, and traffic areas) six area categories are defined in the following (cf. Table 2). Four categories pertain to settlement areas. They are distinguished according to their function, more specifically residential use, commercial/industrial use, public and special use and core area use. A specific category identifying areas with the most urgent need for action has been designated for traffic areas as well as for green and open spaces. This classification has been devised from the perspective of technical planning recommendations and is based exclusively on climatic criteria. A subsequent step will integrate additional factors of vulnerability (cf. chapter ‘Areas of Particular Vulnerability to the Urban Climate’).

Table 2: Categories and methods for identifying areas particularly affected by urban climate impacts

Table 2: Categories and methods for identifying areas particularly affected by urban climate impacts

In total, 3,303 areas have been identified across all categories as requiring urgent action. The vast majority, nearly 91%, fall within the ‘traffic areas’ category. Among the remaining groups, the settlement type ‘public facility and special use’ stands out as the largest, encompassing 191 block (segment) areas and accounting for 5.8%. The final 1.0% is distributed among ‘park | green space | city square | promenade’ (cf. Figure 22).

Figure 22: Percentage distribution of Berlin’s area types particularly affected by urban climate impacts

Figure 22: Percentage distribution of Berlin’s area types particularly affected by urban climate impacts

Overall, areas requiring urgent action have been identified in every Berlin borough. For settlement areas, the most prominent hotspot is located in Mitte, while they are heavily concentrated in Marzahn-Hellersdorf, Pankow, and Treptow-Köpenick when it comes to traffic areas. A secondary cluster appears in the boroughs of Neukölln, Spandau, and Tempelhof Schöneberg. In contrast, Friedrichshain-Kreuzberg and Charlottenburg-Wilmersdorf exhibit the fewest hotspots overall (cf. Figures 23 and 24).

Figure 23: Breakdown of areas particularly affected by urban climate impacts across Berlin’s 12 boroughs

Figure 23: Breakdown of areas particularly affected by urban climate impacts across Berlin’s 12 boroughs

Figure 24: Areas particularly affected by urban climate impacts in Berlin

Figure 24: Areas particularly affected by urban climate impacts in Berlin

Areas of Particular Vulnerability to the Urban Climate

Areas particularly affected by urban climate impacts were designated based solely on a technical planning and climatic perspective. However, combining this analysis with additional non-climatic factors – especially for the ‘settlement area’ unit – can provide valuable insights for a more spatially nuanced assessment of vulnerability, helping to guide the implementation of targeted measures.

Whether an individual block (segment) area within a settlement area is vulnerable to climatic conditions in the city depends not only on the primary factor of time – i.e. when people are present and/or using the space – but also on several secondary factors. Foremost among these is the demographic composition of the neighbourhood under consideration. In addition, the presence of certain sensitive building and land uses and the availability of adequate green spaces in residential areas, greatly affect the overall level of vulnerability.

Particular Vulnerability Due to Demographic Composition

Certain age groups are generally considered especially susceptible to thermal (heat) stress: older adults (those aged 65 and over) due to increased risk of cardiovascular disease with age, and young children under the age of six, particularly infants, due to their limited or undeveloped ability to regulate body temperature (Jendritzky 2007). Empirical studies have shown a correlation between heatwaves and increased mortality in the Berlin-Brandenburg region, which can also be reproduced in model simulations (Scherber 2014; Scherer et al. 2013; Fenner et al. 2015).

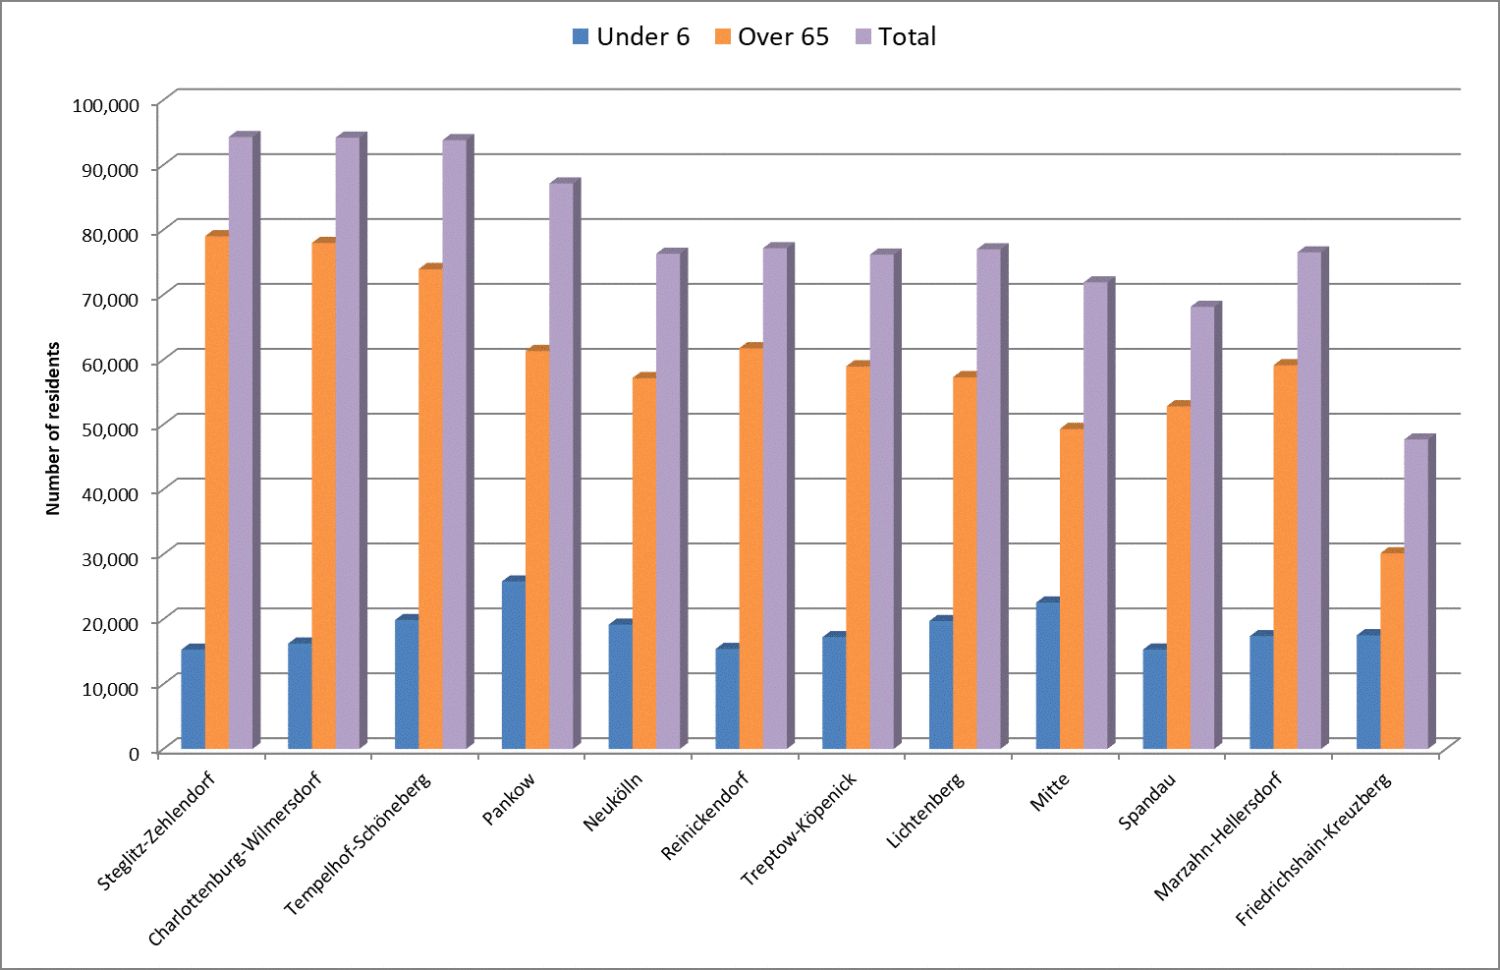
In Berlin, approximately 940,000 people fall into age groups considered susceptible to heat (Statistics by SenStadt 2022). The ratio of older to younger residents susceptible to heat is roughly 3.2 to 1, indicating that older adults make up a significantly larger at-risk group than young children and infants across all boroughs. This disparity is particularly pronounced in Steglitz-Zehlendorf, where the ratio rises to 5.2 to 1 and the total number of residents susceptible to heat is the highest, with nearly 94,300. By contrast, the borough of Friedrichshain-Kreuzberg has the lowest number of individuals susceptible to heat, with around 48,000, and a lower ratio of 1.7 residents aged 65 and over for every one child under the age of six.

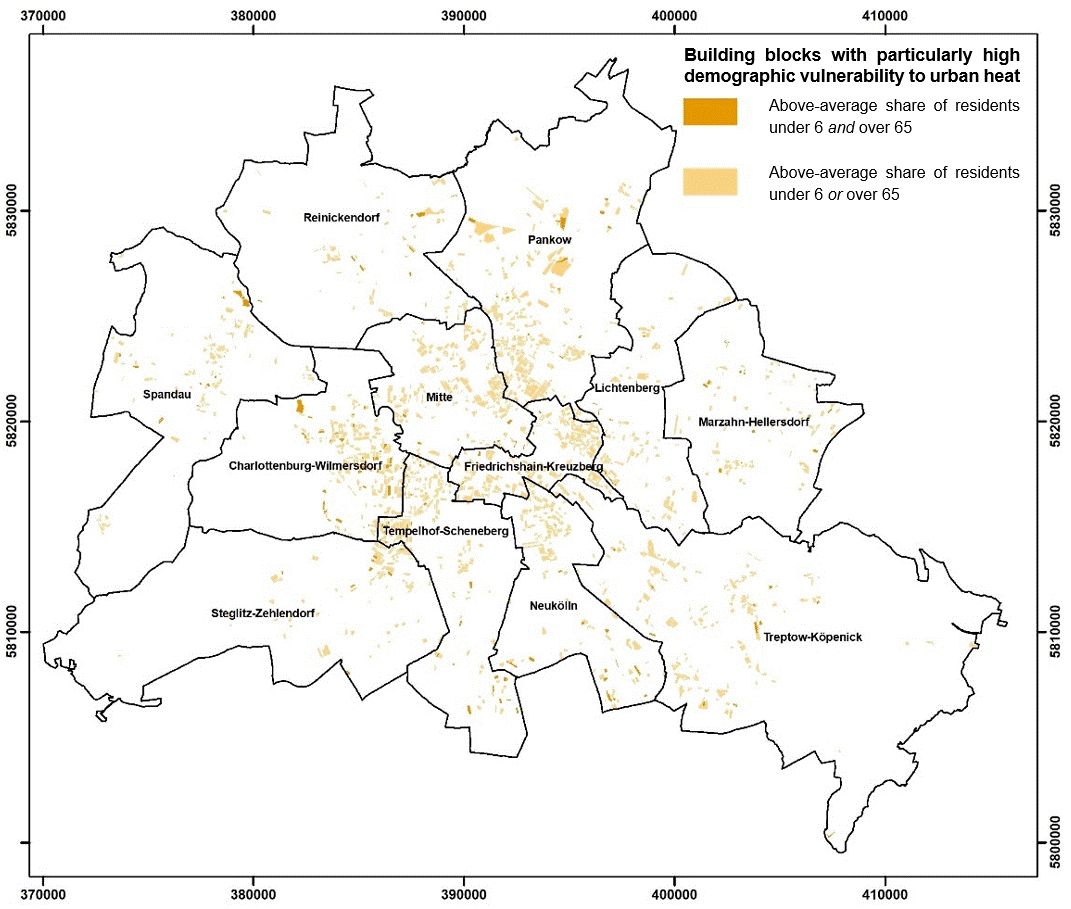
Whether this susceptibility results in actual vulnerability depends heavily on the geographic distribution of these at-risk groups within the nuanced pattern of thermal stress. The analysis shows that approximately 13% of all block (segment) areas exhibit high or very high demographic vulnerability. About one fifth of all Berliners susceptible to heat, roughly 177,000 people, live in these areas. Conversely, this suggests that implementing measures in a relatively small part of the city could provide significant thermal relief to a large share of the vulnerable population. The distribution of demographic vulnerability reflects both the intensity of heat stress and the age structure of the local residents (cf. Figure 25).

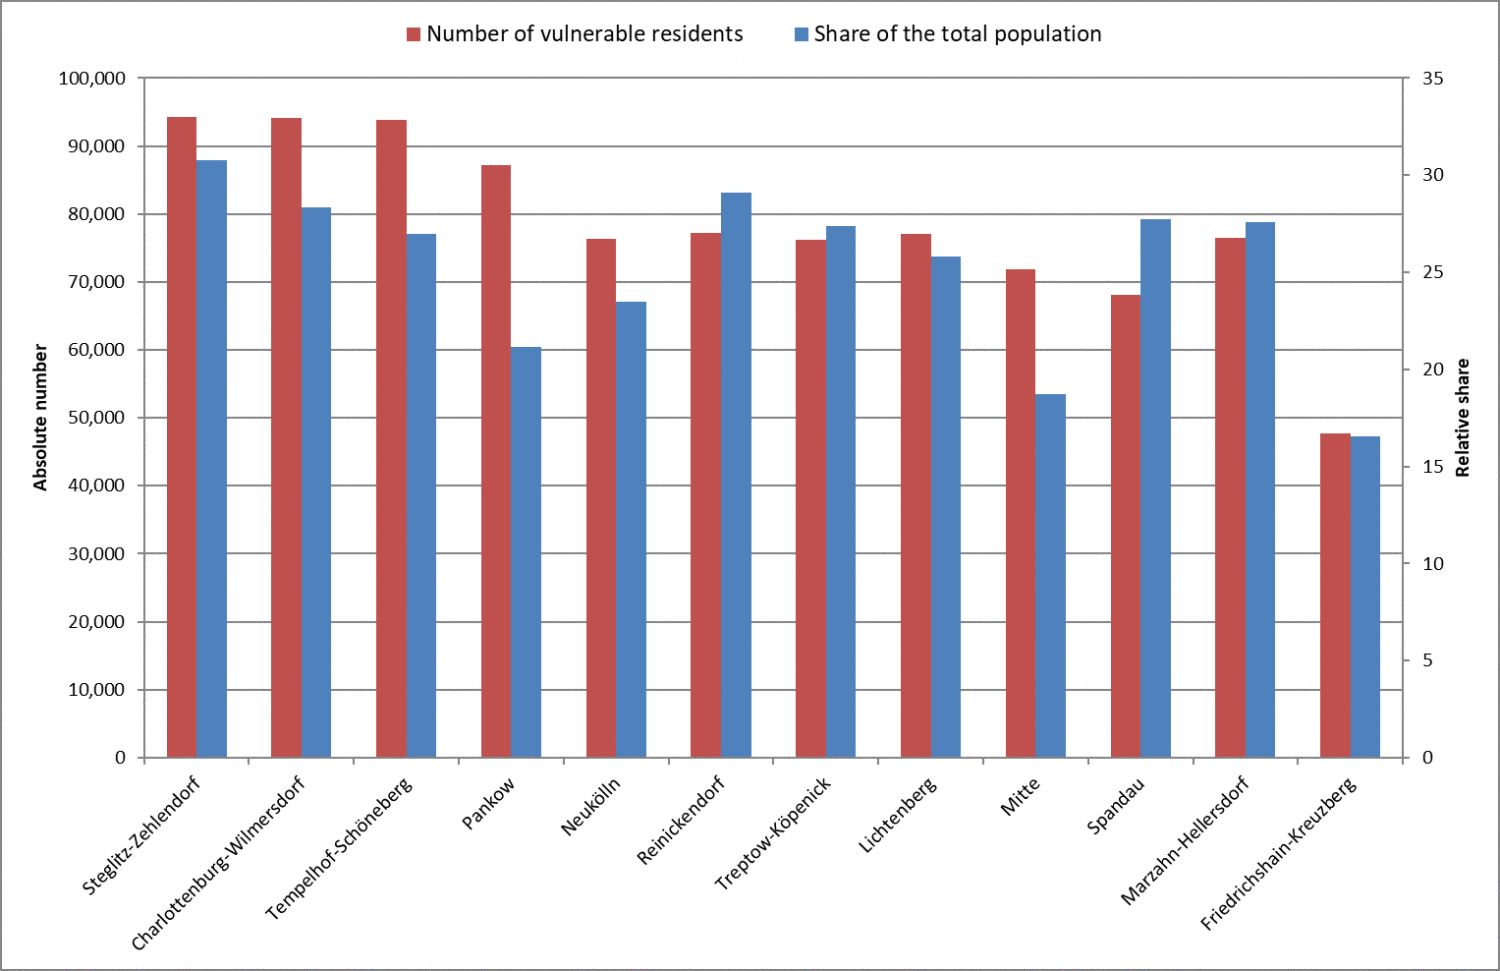
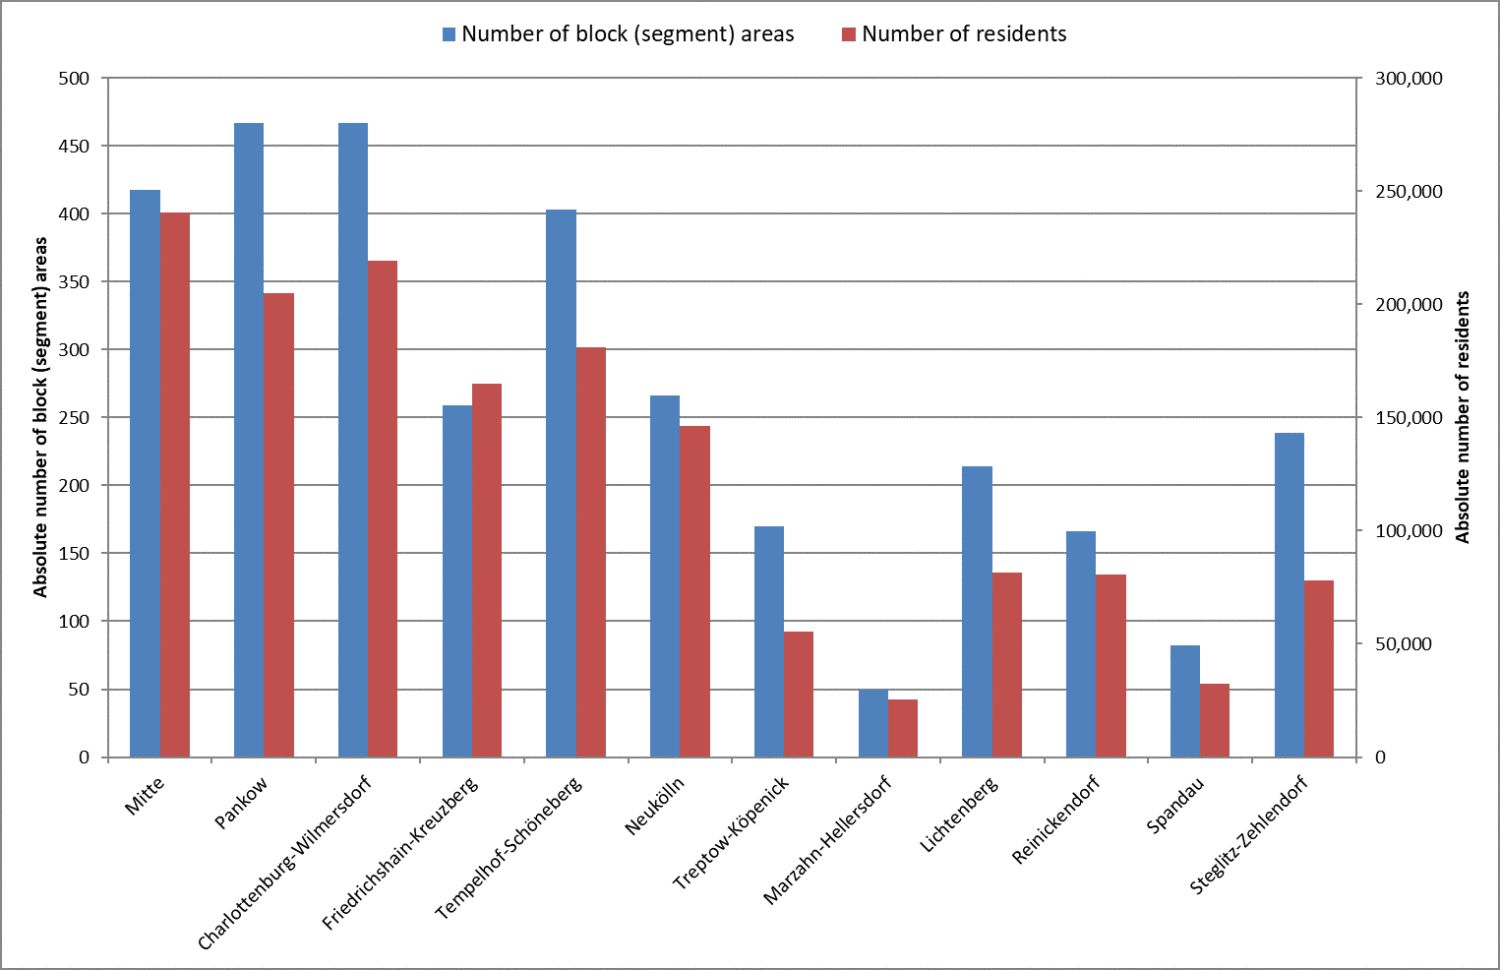
At the borough-level, spatially nuanced analysis further reveals that Steglitz-Zehlendorf, Charlottenburg-Wilmersdorf, and Tempelhof-Schöneberg have the highest absolute numbers of residents in the vulnerable age groups (aged under 6 and over 65), all exceeding 90,000 residents (cf. Figure 26). In comparison, the borough of Friedrichshain-Kreuzberg, has the lowest absolute number, with around 48,000 residents.

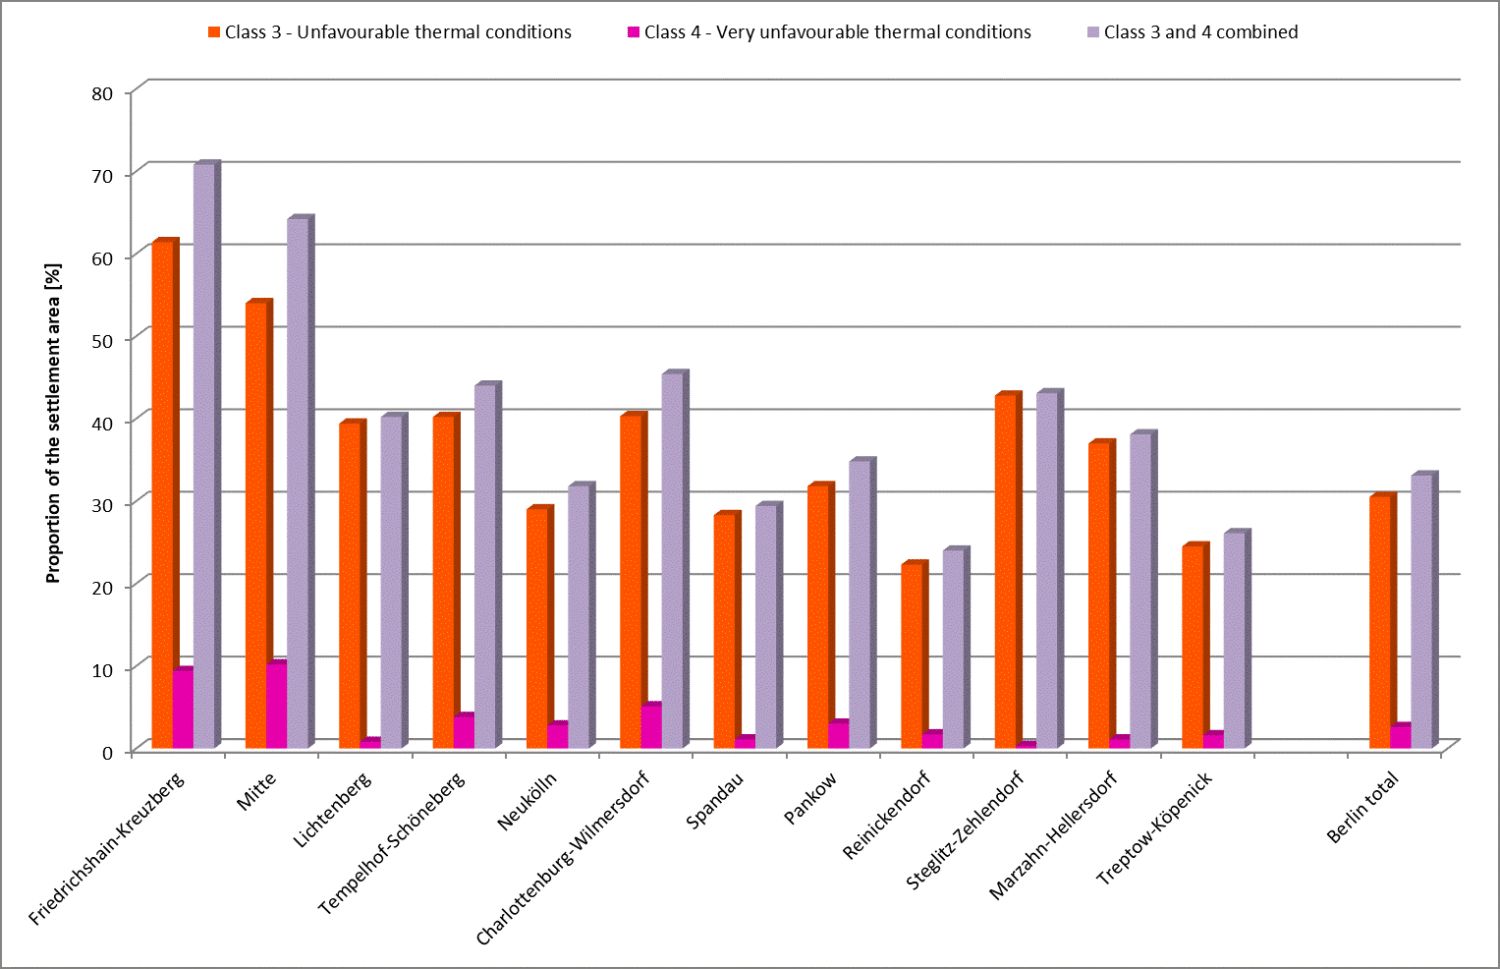
When considered as a percentage of the total population, Steglitz-Zehlendorf and Reinickendorf have the highest shares of residents susceptible to heat, with 30.8% and 29.1% respectively (cf. Figure 27). By contrast, the shares are relatively low in the boroughs of Mitte (18.7%) and Friedrichshain-Kreuzberg, even though both have an above-average proportion of heat-stressed settlement areas, with 64.2% and 70.8% respectively (cf. Figure 26).

Figure 25: Demographic vulnerability to thermal stress – spatial analysis at the block (segment) level in Berlin

Figure 25: Demographic vulnerability to thermal stress – spatial analysis at the block (segment) level in Berlin

Figure 26: Number of vulnerable residents – breakdown by Berlin borough

Figure 26: Number of vulnerable residents – breakdown by Berlin borough

Figure 27: Number of vulnerable residents and their share of the total population – breakdown by Berlin borough

Figure 27: Number of vulnerable residents and their share of the total population – breakdown by Berlin borough

Particular Vulnerability Due to Land and Building Uses Sensitive to Climatic Conditions

From an urban climate perspective, certain types of land and building uses are regarded as particularly sensitive to heat, especially those frequently used by at-risk population groups. For the present analysis, seven specific use types were identified: hospitals, nursing homes, daycare centres, schools, after-school care centres, playgrounds, and sports facilities. According to the latest available data, there are currently around 7,300 distinct instances of these uses recorded in the sub-areas of the three main spatial units defined in the Urban Climate Planning Guidelines from 2022 (PHK 2022). Playgrounds and daycare centres make up the majority of these, accounting for approximately 61%.

Overall, about 20% of settlement areas, approximately 9% of green and open spaces, and 0.2% of all sub-areas within the ‘traffic areas’ spatial unit contain at least one type of climate-sensitive land use. In more than 88% of cases, no more than two different use types appear within the same sub-area, although in individual cases, clusters of up to six types can occur.

Sensitive building and land uses are distributed relatively evenly across Berlin and, at the borough level, closely correlate with population size. As a general rule: the more residents a borough has, the more climate-sensitive uses are present. The borough of Pankow, with 280 affected block (segment) areas, sits at the top of the scale. At the lower end, Marzahn-Hellersdorf and Reinickendorf each have 139 and 135 block (segment) areas, respectively, with at least one climate-sensitive use. The evaluation indicates that this topic, too, is relevant throughout all of Berlin’s boroughs.

Whether this sensitivity results in actual vulnerability depends heavily on the geographic distribution of the individual regions within the nuanced pattern of thermal stress. In absolute terms, the highest number of areas with vulnerable uses is found in Pankow, which also has the greatest number of sensitive (i.e. potentially vulnerable) building and land uses overall. Aside from this, the results show no further correlation between the frequency of vulnerable or sensitive uses and population size. This stems from the uneven spatial distribution of sensitive uses in terms of their proportion within thermally stressed areas across the city. For Berlin as a whole, this figure stands at around 46%. It varies widely across the twelve boroughs, however, ranging from approximately 34% in Steglitz-Zehlendorf to 58% in Pankow (cf. Figure 28).

Figure 28: Absolute number and relative proportion of sensitive uses at the block level within thermally stressed environments across the 12 boroughs

Figure 28: Absolute number and relative proportion of sensitive uses at the block level within thermally stressed environments across the 12 boroughs

In comparison, the ranking of the absolute number of vulnerable use types aligns exactly with that of the sensitive types. Playgrounds and daycare centres are also by far the most common, accounting for 60% of the total 2,618 block segment areas identified with vulnerable land or building uses (cf. Figure 29). As in the borough-level analysis, there are notable differences in how often sensitive uses also constitute vulnerable ones. Particularly concerning is the high proportion of schools, daycare centres, and hospitals located in thermally stressed environments. In all three cases, the proportion is well above 50%. This underscores the urgent need for action in these areas.

Figure 29: Absolute number and relative proportion of block (segment) areas with sensitive use types within thermally stressed environments in Berlin

Figure 29: Absolute number and relative proportion of block (segment) areas with sensitive use types within thermally stressed environments in Berlin

Particular Vulnerability Due to a Lack of Green Space

In addition to generating cold air, Berlin’s green and open spaces provide a second key ecosystem service relevant to the urban climate. On hot days, they serve as urban cooling islands where heat-stressed residents can actively seek thermal relief. While larger, contiguous green spaces (exceeding 1-2 hectares) are necessary to generate sufficient volumes of cold air to make an impact, it is the network of smaller, evenly distributed green spaces that is particularly well suited for short-term recreation. From a social and environmental justice perspective, this is the only way to ensure that all Berliners have the opportunity to meet their recreational needs (Scherer 2007).

At a finer scale, thoroughly shaded green and open spaces are especially important in areas where significant daytime heat stress coincides with a lack of private green space. By combining these two parameters, it is possible to identify block (segment) areas that are particularly vulnerable to climatic conditions due to a lack of green space. These areas require special attention, including the creation of small spaces that provide thermal comfort (‘pocket parks’) in both private and public spaces.

Citywide, a total of 3,201 block (segment) areas have been identified as vulnerable to urban heat due to a lack of green space. This corresponds to about 19% of all block (segment) areas or 15.7% of the total settlement area. These areas are home to around 1.51 million residents, including approximately 322,500 individuals classified as at-risk populations.

Although these vulnerable areas are dispersed throughout the city, spatial hotspots are apparent. The boroughs of Pankow, Charlottenburg-Wilmersdorf, and Mitte contain the highest numbers of affected block (segment) areas and residents. Of a total of 4,078 block (segment) areas in these boroughs, 24% in Pankow, 41% in Mitte, and 42% in Charlottenburg-Wilmersdorf have a lack of green space. Together, these three boroughs are home to around 137,000 residents who belong to an at-risk population group.

The most favourable conditions are observed in Marzahn-Hellersdorf, where a lack of green space affecting thermal comfort impacts around 25,000 residents (cf. Figures 30 and 31).

Figure 30: Spatial representation of areas particularly vulnerable to the urban climate due to a lack of green space in Berlin

Figure 30: Spatial representation of areas particularly vulnerable to the urban climate due to a lack of green space in Berlin

Figure 31: Breakdown of urban climate vulnerability due to a lack of green space across Berlin’s 12 boroughs

Figure 31: Breakdown of urban climate vulnerability due to a lack of green space across Berlin’s 12 boroughs

Map 04.11.3 Measures

Each type of urban structure and land use presents different starting conditions for climate mitigation and adaptation. The specific need for action, appropriate measures, and their feasibility all depend on the structure type and are influenced by several factors. In addition to geographical location and the degree of exposure, such as to heat stress, these factors also include typical features of the urban fabric, like the spatial arrangement of buildings and open spaces. Additionally, it is essential to determine whether, and to what extent, land is actually available for implementing such measures.

At the third main level of the PHK 2022, around 53,000 block (segment) and road areas were assigned to one of 16 different measures or planning guidelines. These are based on the ‘Urban Development Plan Climate 2.0’ (StEP Klima 2.0), which outlines a total of 23 measures for key settlement and traffic areas (SenStadt 2021b). To determine suitable measures for settlement areas and open spaces, urban structure types and area types were used as a basis. For this purpose, StEP Klima derived spatial typologies from the Berlin Environmental Atlas, carrying out new aggregations or simplifications for some of the types.

Ten urban structure and area types are taken into consideration, with a primary focus on those that exhibit a distinctly urban character. Other types, such as sports and recreation areas, agricultural or horticultural land, forests, infrastructure areas with significant tree cover, and bodies of water, possess such unique characteristics that general strategies can only be applied to them in a limited way.

StEP Klima outlines the following approaches to action, each linked to specific measures (cf. Figure 31):

  1. City of short distances (not included in the PHK)
  2. Blue-green urban development
  3. Climate-adaptive cooling green and open spaces
  4. Water-sensitive urban development
  5. Preventive measures for heavy rainfall and flooding

The relevance of each measure for specific structure types was evaluated based on several criteria: level of exposure, specific need for action within the structure type, suitability and effectiveness of the measures, as well as spatial availability and practical feasibility. Detailed descriptions of the 16 individual measures are provided in the accompanying document to the Urban Development Plan Climate 2.0.

Figure 32: Priority of climate mitigation and adaptation measures for urban structure and area types from StEP Klima 2.0, adapted

Figure 32: Priority of climate mitigation and adaptation measures for urban structure and area types from StEP Klima 2.0, adapted

Contact

Leilah Haag