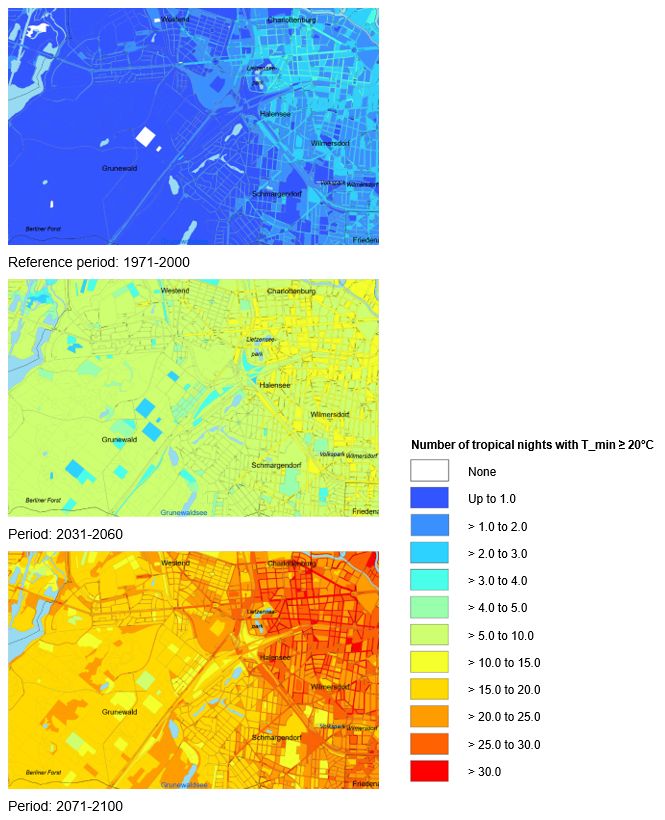
The results reveal the spatial patterns of heat events in Berlin and how their frequencies have evolved over time. On a small scale, the frequency of these events is primarily influenced by the land use of each area. Please refer to the documentation for a detailed breakdown of the number of threshold days by land use type or settlement structure. The average frequencies of heat events in the individual boroughs reflect their predominant urban structure as well as their proportion of green spaces and water bodies. Especially in the light of potential health impacts caused by prolonged heatwaves, these findings complement the results of the Climate Analysis and may help prioritise and plan adaptation measures in the city. Additionally, they illustrate the effects of urban climate dynamics.
Summer Days and Hot Days
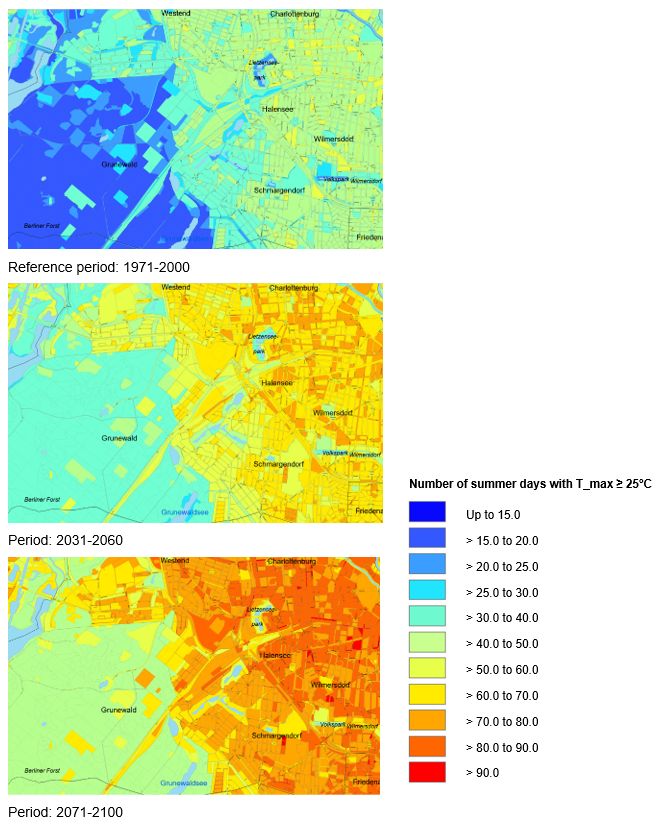
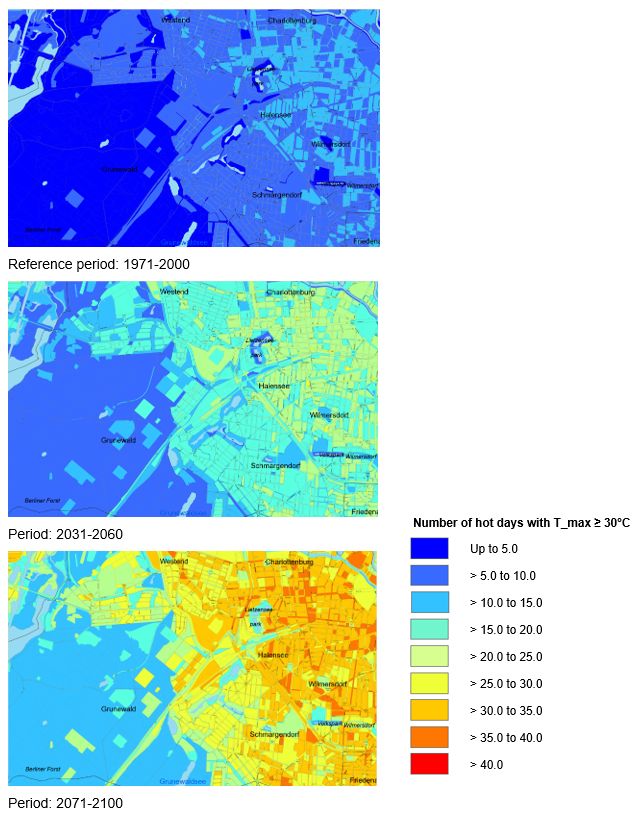
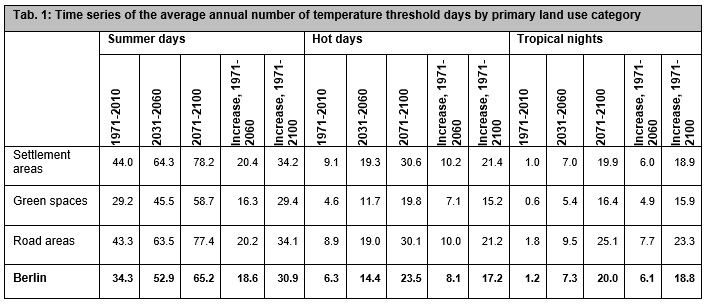
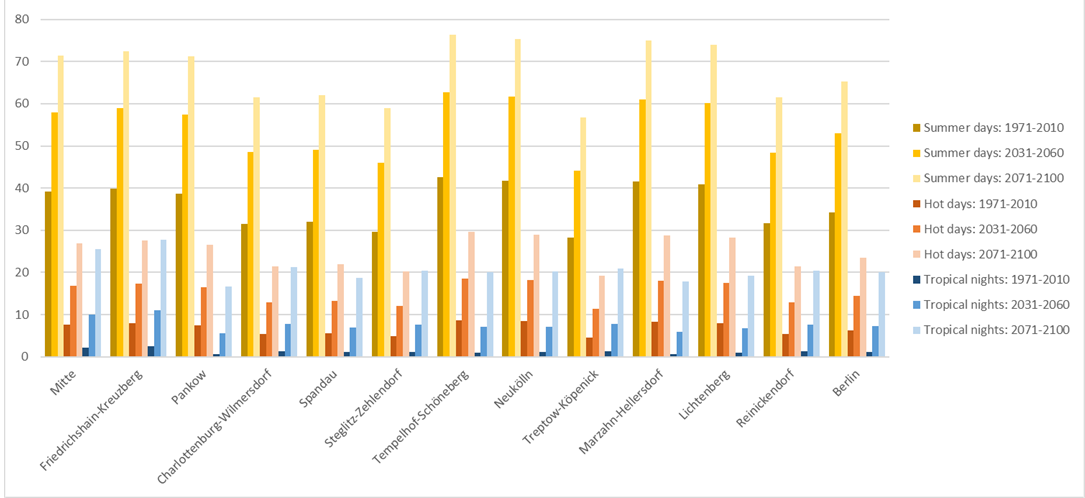
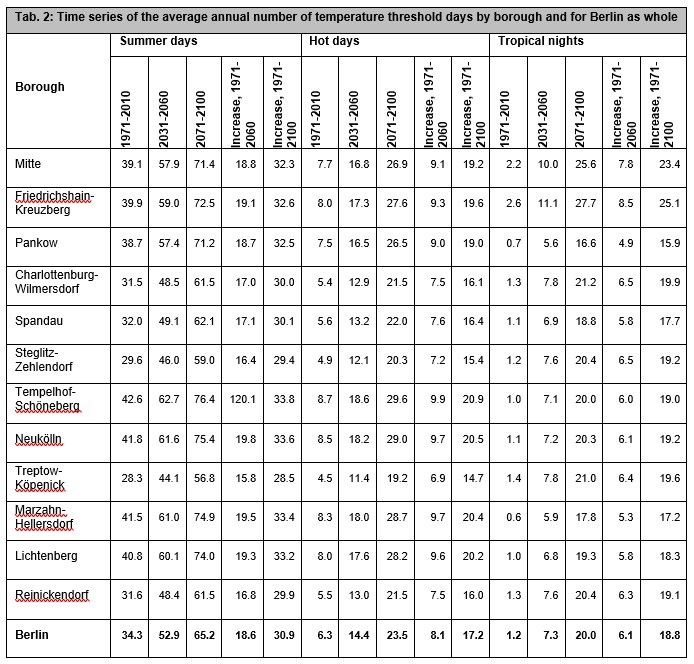
The number of summer days (Fig. 2) and hot days (Fig. 3) is noticeably higher in areas where air temperatures are elevated during the day. These areas are typically densely built-up and lack shade, with a high degree of impervious coverage. They include commercial and industrial areas, core areas as well as areas with closed block development and courtyards without shade. On average, these areas recorded 49 to 50 summer days and about 11 hot days per year during the reference period from 1971 to 2000. The frequency is noticeably higher than the national average for the same period, which saw 30.4 summer days and 5.2 hot days annually.
Open green spaces and farmland experience around 40 summer days and 8 hot days on average per year. In contrast, the number of summer days and hot days is considerably lower in the forests, where the tree canopy provides extensive shade and evaporation moderates temperatures. Forests therefore recorded an average of 20 summer days and 2 hot days annually during the reference period, which is below the national average for the same timeframe. Area segments directly adjacent to water bodies also tend to experience fewer summer and hot days. Due to their high heat capacity, waters heat up relatively slowly, cooling the surrounding air in the process.
Climate change is expected to lead to an increase in the number of summer and hot days. This increase will be more pronounced in regions where such days were already frequent during the reference period than in regions where this was not the case. Between 2031 and 2060, settlement areas are projected to experience an average of 20 additional summer days and 10 additional hot days per year. Green spaces are expected to see an average increase of 16 summer days and around 7 hot days per year. This development will lead to an average of about 71 summer days and 22 hot days per year in urban areas with a high thermal burden. Compared to the national average, such values have only been observed in extreme heatwave years in the past, for example in 2018 with 74.7 summer days and 20.3 hot days. In the same period, the number of summer days is expected to reach an average of 34 per year, while hot days may climb to about 7 in the forests.
Summer and hot days are expected to become even more frequent by the end of the century. In the urban areas with the highest thermal burden, an average of 84 to 85 summer days and 34 to 35 hot days per year are expected between 2071 and 2100. In the forests, these figures are projected to rise to about 46 summer days and 13 hot days per year.