Long-term Development of Selected Climate Parameters 2013

Excursus: Estimation of possible effects of climate change

Preliminary remark

The climate change that is taking place according to the findings of the IPCC (IPCC 2014) will have impacts also on Berlin in different areas of life.

The State of Berlin has long recognized the urgency that these prognoses imply for the city and has responded with already prepared plans and measures addressing both the area of mitigation and that of adaptation, and is continuously developing them further.

Detailed information on these goals and fundamentals as well as on agreements and measures already adopted is available and regularly updated on the pages Climate Protection of the Senate Department.

In the framework of the aforementioned ERDF project "GIS-based modelling of parameters relevant to urban climate on the basis of high-resolution data on buildings and vegetation" (GEO-NET 2014), an estimation of the possible future development of the climate in Berlin was carried out with respect to the evaluation of three climate stations: Berlin-Dahlem, Berlin-Tempelhof and Berlin-Tegel. For these stations, prognostic data of the regionalisation model WettReg 2010 (CEC Potsdam) are available that are used to assess the future situation. The regional climate model WettReg was already used in the framework of the co-operation agreement between the German Meteorological Service (DWD), Section Climate and Environmental Consulting and the Senate Department for Urban Development, Section Geo-Information, Unit Urban and Environmental Information System, which resulted in the first comprehensive illustrations of the possible effects of climate change on the changes in the temperature behaviour being prepared for Berlin (SenStadt 2010).

For more information on WettReg, the uncertainty necessarily inherent in climate projections and further conditions, see the explanations presented in connection with this work in the accompanying text of the Environmental Atlas (cf. 04.12, Chapter Methodology) .

For the estimations described below, the regional climate model WETTREG 2010 was applied to the 3 Berlin climate stations mentioned, with 10 model runs each with the emission scenario A1B.

Results of the regional climate model WETTREG 2010 for three selected climate stations in Berlin

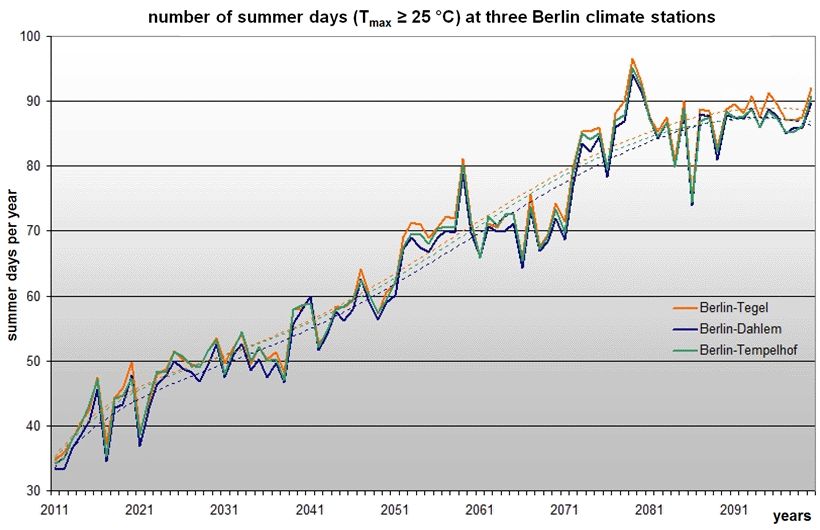
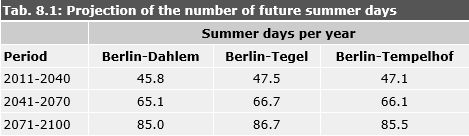
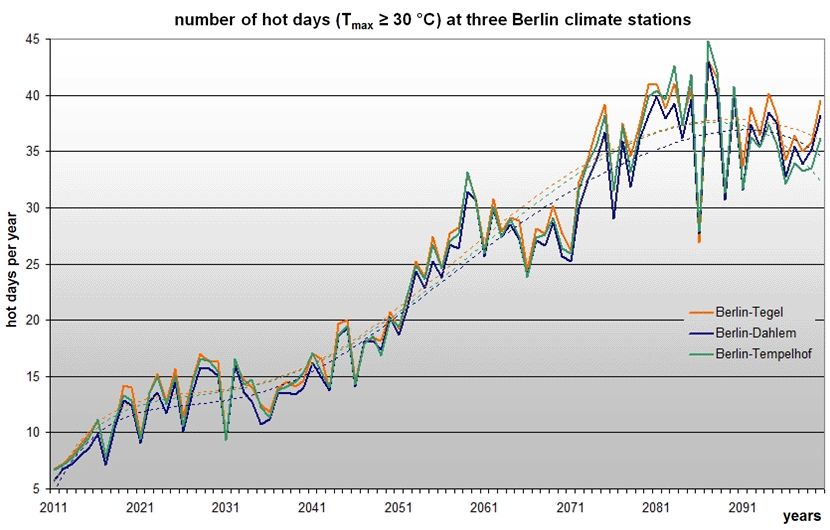
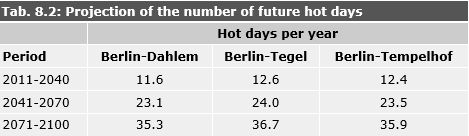
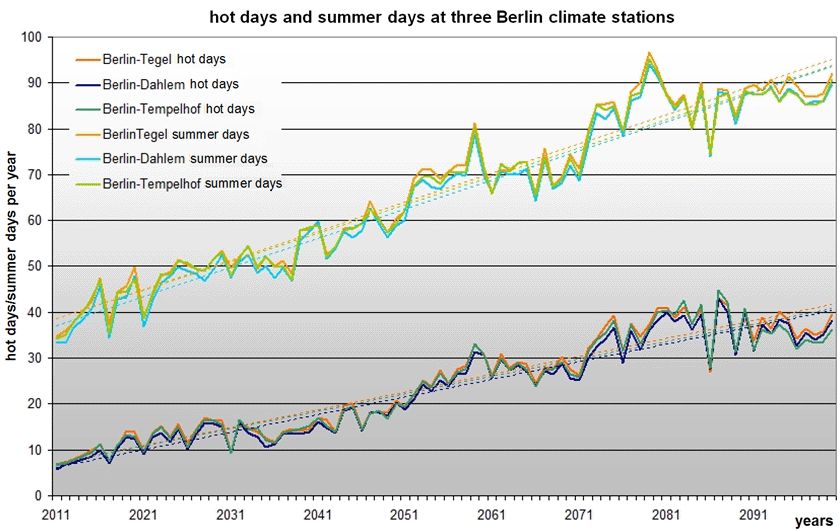
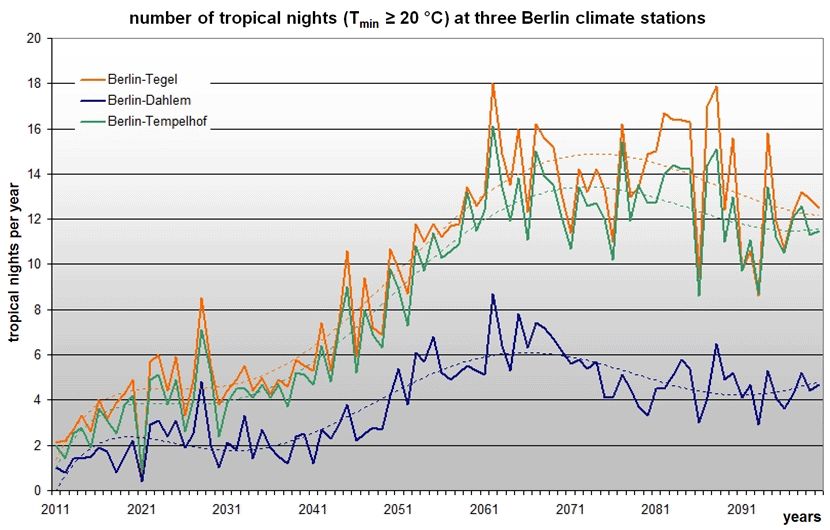
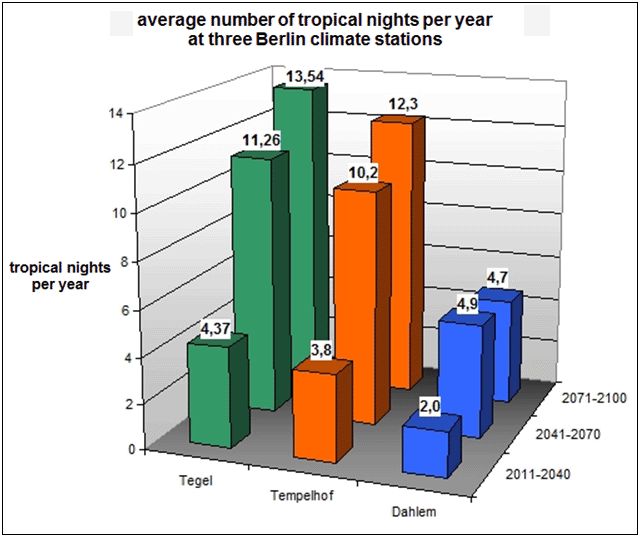
The climatic system in Berlin that is segmented according to the urban structures will be fundamentally preserved for autochthonous[1] weather conditions under the influence of climate change. However, due to the gradual warming of the atmosphere, relevant changes are to be expected in the course of the century for the human-biometeorological load level. These developments will be quantified in the following. The time periods 2011-2040, 2041-2070 and 2071-2100 will be considered, as is usual for such investigations.

Annual mean values of the air temperature

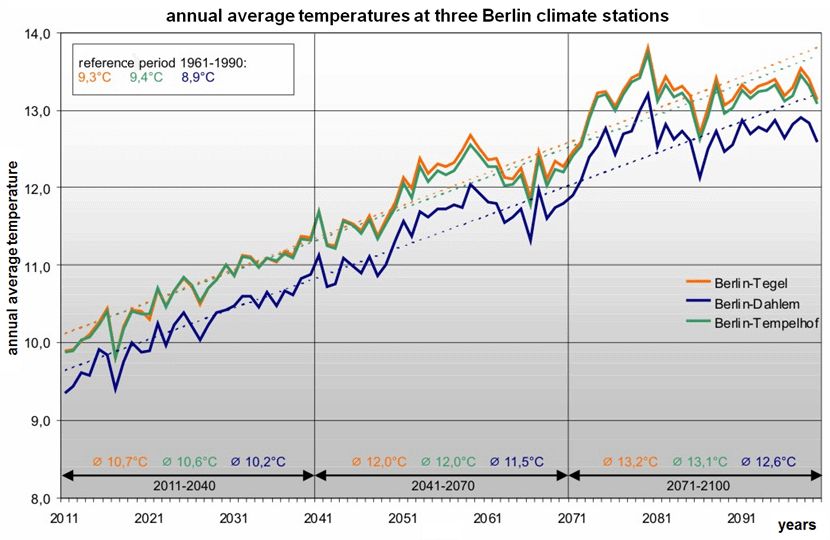
The development of the local near-ground annual average temperature is a first indicator for the extent of the future human-biometeorological load situation in Berlin. It has risen moderately but steadily since the beginning of the Industrial Revolution, and in the past climate normal period 1961-1990 it was 8.9, 9.3 and 9.4 °C, respectively, for the three climate stations considered in Berlin (see Fig. 8.2). Under the influence of climate change, this development will not only continue but will intensify already in the coming decades. Taking the scenario A1B as a basis yields a further increase

  • +in the short term+ (climate period 2011-2040) by +1.4 K (Kelvin) (Tegel), +1.2 K (Tempelhof) and +1.3 K (Dahlem),
  • +in the medium term+ (2041-2070) by +2.7 K (Tegel), +2.6 K (Tempelhof) and 2.6 K (Dahlem) and
  • +in the long term+ (2071-2100) by +3.9 K (Tegel), +3.7 K (Tempelhof) and +3.7 K (Dahlem).

As illustrated in Figure 8.2, a steady rise in the annual average temperatures up to the end of the 21st century is to be expected. The development of the annual mean temperatures is subject to the natural fluctuations of the climate. The climate stations Berlin-Tegel and Berlin-Tempelhof exhibit a very similar development of the temperatures. The Dahlem station shows less pronounced values throughout. This reflects the location of the climate stations in the urban space. Whereas the Berlin-Tegel and Berlin-Tempelhof stations represent relief spaces within densely built-up urban areas, the Berlin-Dahlem station has a more peripheral location. The heat island effect is not as pronounced here as at the other two sites. Data from a station with a very urban location in very densely built-up areas (e.g. Berlin-Alexanderplatz), in which even higher temperatures are to be expected overall, are not available for this evaluation.

Fig. 8.2: Projection of future near-ground annual mean temperatures at three Berlin climate stations for the time period 2011 to 2100; WETTREG simulation, scenario A1B, (dashed lines = linear trend)

Fig. 8.2: Projection of future near-ground annual mean temperatures at three Berlin climate stations for the time period 2011 to 2100; WETTREG simulation, scenario A1B, (dashed lines = linear trend)

Frequency of occurrence of meteorological threshold days

A gradual warming of the near-ground air layers is significant from a human-biometeorological perspective only if it is concomitant with an intensification or an increased frequency of occurrence of load situations. The frequencies of occurrence of the meteorological threshold days summer days (Tmax ≥ 25 °C), hot days (Tmax ≥ 30 °C) and tropical nights (Tmin ≥ 20 °C) are good indicators for this.

A consideration of the manifestations of the different parameters for the three Berlin climate stations shows that they differ significantly only in the manifestation of the tropical nights. Here, too, the trend of increasing frequency of occurrence of the threshold days under consideration that emerges from the climate observations of the past decades (cf. Chapter "Results of the station evaluations") continues and intensifies.

Frequency of occurrence of summer days

Figure 8.3 shows the temporal course of the number of summer days at the three evaluated climate stations from 2011 to 2100. Days with a daily maximum temperature of 25 °C or more are regarded as summer days. The development of the summer days is projected similarly for all three stations. Whereas at the beginning of the century the number of summer days is about 35 to 37 per year, by the end of the century it rises sharply to 89 to 92 summer days per year. Here the polynomial trend lines follow the natural fluctuations of the values, which also lead to the maximum number of summer days of this climate modelling already being reached before the end of the 21st century. The highest number of summer days is projected for the year 2079 for all three stations, namely 94.1 days for Dahlem, 95.2 days for Tempelhof and 96.6 days for Tegel.

Fig. 8.3: Projection of the number of future summer days at three Berlin climate stations for the time period 2011 to 2100; WETTREG simulation, scenario A1B, (dashed lines = polynomial trend)

Fig. 8.3: Projection of the number of future summer days at three Berlin climate stations for the time period 2011 to 2100; WETTREG simulation, scenario A1B, (dashed lines = polynomial trend)

Table 8.1 shows the average number of summer days per year in the three periods (2011-2040, 2041-2070 and 2071-2100) for the selected climate stations. Here, too, the projected marked increase of the summer days per year is apparent. The number of summer days per year almost doubles from the period 2011-2040 to the period 2071-2100.

Tab. 8.1: Projection of the number of future summer days at three Berlin climate stations (periods 2011-2040, 2041-2070, 2071-2100); WETTREG simulation, scenario A1B

Tab. 8.1: Projection of the number of future summer days at three Berlin climate stations (periods 2011-2040, 2041-2070, 2071-2100); WETTREG simulation, scenario A1B

Frequency of occurrence of hot days

Weather situations in which the daily maximum temperature is 30 °C or higher are referred to as hot days.

Figure 8.4 shows the development of the hot days from 2011 to 2100. The natural fluctuations of the climate in the course of a century are clearly visible here from the curved trend line. Nevertheless, the increase in the number of hot days per year can be discerned clearly. As described in the chapter "Results of the station evaluations", the number of hot days in Berlin has been rising for decades. The climate modelling using WETTREG shows that in future this rise will be much more rapid. Whereas in 2011 5 to 7 hot days per year are assumed, 36 to 39 hot days per year are expected in 2100. The highest number of hot days is projected for the year 2087 with 43.1 hot days for the Berlin-Tegel and Berlin-Dahlem stations and 44.8 days for Berlin-Tempelhof.

Fig. 8.4: Projection of the number of future hot days at three Berlin climate stations for the time period 2011-2100; WETTREG simulation, scenario A1B, (dashed lines = polynomial trend)

Fig. 8.4: Projection of the number of future hot days at three Berlin climate stations for the time period 2011-2100; WETTREG simulation, scenario A1B, (dashed lines = polynomial trend)

Also with respect to the projected development of the number of hot days there are no relevant differences between the stations considered, as seen in Table 8.2, which shows the number of hot days for three periods. From the first period at the beginning of the century to the last period under consideration, the values are tripled.

Tab. 8.2: Projection of the number of future hot days at three Berlin climate stations (periods 2011-2040, 2041-2070, 2071-2100); WETTREG simulation, scenario A1B

Tab. 8.2: Projection of the number of future hot days at three Berlin climate stations (periods 2011-2040, 2041-2070, 2071-2100); WETTREG simulation, scenario A1B

Figure 8.5 shows a summary of the development of the summer days and hot days at the three climate stations considered. A linear representation was chosen for the sake of illustrating the trend. It is apparent that the manifestation of summer days and hot days is correlated. However, the slope of the trend lines of the parameters shows that the increase in the summer days is more rapid overall than the increase in the hot days.

Fig. 8.5: Common projection of the number of future summer days and hot days at three Berlin climate stations for the time period 2011 to 2100; WETTREG simulation, projection A1B, (dashed lines = linear trend)

Fig. 8.5: Common projection of the number of future summer days and hot days at three Berlin climate stations for the time period 2011 to 2100; WETTREG simulation, projection A1B, (dashed lines = linear trend)

Frequency of occurrence of tropical nights

A situation in which the nocturnal minimum temperature does not fall below 20 °C is referred to as a tropical night. This is associated with a considerable heat load for humans.

Overall, the number of tropical nights per year also increases up to the end of the century. However, in this case marked differences can be discerned in the manifestation of the parameter between the three climate stations in Berlin. The highest number of tropical nights per year for the entire period under consideration is projected at the Berlin-Tegel station. Here the value lies between 2 tropical nights in 2011 and at the end of the century 12.5 tropical nights in 2100. This corresponds to an increase in the number of tropical nights by a factor of about six in 90 years. For the Berlin-Tempelhof station, the modelling for the development of the tropical nights mostly lies slightly below the modelling for Berlin-Tegel. Here the number of tropical nights per year increases from 2 in 2011 to 11.5 in 2100. The manifestation of tropical nights is significantly lower for the Berlin-Dahlem station. The development goes from 1 tropical night in 2011 up to 4.7 tropical nights in 2100 (cf. Fig. 8.6). Thus less than half as many tropical nights are projected for Berlin-Dahlem than for the other two sites in Berlin.

Fig. 8.6: Projection of the number of future tropical nights at three Berlin climate stations for the time period 2011 to 2100; WETTREG simulation, scenario A1B,

Fig. 8.6: Projection of the number of future tropical nights at three Berlin climate stations for the time period 2011 to 2100; WETTREG simulation, scenario A1B,

The history of the development of the tropical nights at the three climate stations is basically similar, though at the Dahlem station the increase up to 2062 is significantly lower. For all three stations, the maximum of tropical nights is attained in 2062. In this year, 8.7 tropical nights are attained in Dahlem, 18 tropical nights in Tegel and 16.1 nights with a temperature minimum at least 20 °C in Tempelhof. Beyond this year, the values at all three climate stations exhibit a slight downward tendency. This reflects the natural fluctuations of the climate. Due to the relatively low manifestation of tropical nights in comparison to hot days and particularly summer days, the fluctuations can be read off the presentation in the graph much more clearly than for the parameters considered previously.

To illustrate the differences in the values at the three sites, Figure 8.7 shows a diagram which represents the average number of tropical nights per year in the three reference periods of 30 years each up to the end of the 21st century.

Fig. 8.7: Projection of the number of future tropical nights at three Berlin climate stations for the reference periods 2011-2040, 2041-2070, 2071-2100; WETTREG simulation, scenario A1B

Fig. 8.7: Projection of the number of future tropical nights at three Berlin climate stations for the reference periods 2011-2040, 2041-2070, 2071-2100; WETTREG simulation, scenario A1B

Frequency of occurrence of heat waves

High temperatures are particularly burdensome if they persist for a long time. The term heat wave is not clearly defined. Temperature threshold values and other conditions (e.g.: humidity or duration) differ according to country or region. This is due to the climatic differences, which also result in a different acclimatisation of the population (with respect to a healthy person of average age) to high temperatures. There is no official definition of a heat wave in Germany. In this investigation, 5 days with maximum temperatures above 30 °C are assumed to constitute a heat wave.

Figure 8.8 shows the projected development of heat waves up to the end of the century. At the beginning of the time series under consideration (2011), heat waves still occur at all three sites with a statistical frequency of under 0.5 times per year. Up to about 2050, the frequency of heat waves at first increases only moderately and amounts to about 1 to 2 heat waves per year. By contrast, the second half of the century exhibits a stronger increase. Roughly in the 2080s, WETTREG projects the highest annual number of heat waves with probabilities of occurrence of about 3 to 4.5 times per year. Towards the end of the 21st century, a decrease in the heat waves to be expected is indicated. This development correlates with the manifestations of the other parameters considered. No significant difference can be discerned for this parameter between the three stations considered.

Fig. 8.8: Projection of the average number of future hot waves per year at three Berlin climate stations for the time period 2011 to 2100; WETTREG projection, scenario A1B, (dashed lines = polynomial trend)

Fig. 8.8: Projection of the average number of future hot waves per year at three Berlin climate stations for the time period 2011 to 2100; WETTREG projection, scenario A1B, (dashed lines = polynomial trend)

To allow the future duration of heat waves to be assessed, Figure 8.9 shows the maximum number of consecutive hot days per year and the mean number of consecutive hot days per year. Here, too, the manifestation of the values of all three Berlin climate stations correlates strongly. The mean number of consecutive hot days only exhibits a slight increasing trend. It increases from the beginning of the century (about 3 days) to about 5 days at the end of the century. The increase in the maximum number of hot days per year is much more marked. It increases from about 4 days to 12 to 14 days in 90 years. The spread of the values is high.

It becomes apparent that in future not only more frequent heat waves are to be expected, but also more extended ones. However, extremely long heat waves remain the exception and not the rule, as indicated by the only slightly increasing mean number of hot days per year.

Fig. 8.9: Projection of the mean and maximum number of future consecutive hot days per year at three Berlin climate stations for the time period 2011 to 2100; WETTREG projection, scenario A1B, (dashed lines = polynomial trend).

Fig. 8.9: Projection of the mean and maximum number of future consecutive hot days per year at three Berlin climate stations for the time period 2011 to 2100; WETTREG projection, scenario A1B, (dashed lines = polynomial trend).

Summary of possible climate change effects in Berlin

The analysis of the WETTREG projection up to 2100 for the three Berlin climate stations Dahlem, Tegel and Tempelhof shows that the trend of increasing temperatures and especially of increasing extreme values that could already be observed in the past decades will continue and will even grow stronger in the coming years and decades.

As a consequence, according to the current state of knowledge the human-biometeorological loads for the population will increase. Particularly the investigated parameters hot days and tropical nights represent critical load situations for the human organism. A strong increase in the number of hot days will occur at all sites considered, and only Dahlem shows an advantage with respect to the development of the tropical nights. Here, the manifestation of the tropical nights to be expected up to the end of the 21st century is significantly lower than at the other two sites. This is due to the location of the climate station outside the inner city in the area of single-family homes. Due to the greater greening of the surroundings of the station, more cooling can occur at night than in the more strongly sealed and urban areas of the other two climate stations. The significantly cooler nights in the Dahlem area are also reflected in the projected annual mean temperature for this station, which thus constantly lies approx. half a degree below the temperatures in Tegel and Tempelhof. In view of the health relevance mentioned, attention must also be paid to the increasing load due to heat waves, both in the number of their occurrence and in their more pronounced manifestation.

Although the station was not included in the comparison, it is to be expected on the basis of the evaluations in the chapter "Results of the station evaluations" that the Alexanderplatz site would have significantly exceeded the trend representations of the individual parameters of the Tegel and Tempelhof sites due to its far more urban surroundings compared to Tempelhof and Tegel.