Nitrogen monoxide and nitrogen dioxide are measured at all measurement stations (using the chemiluminescence procedure), dust of the PM10 and PM2.5 fraction at twelve stations (by measuring the scattering of light by dust particles, ozone at eight stations (through absorption of UV radiation), carbon monoxide at two stations (through absorption of infrared radiation) and benzene at two stations (through gas chromatography). As of June 1, 2020, SO2 is no longer measured using the reference method, as SO2 levels have decreased dramatically over the last 30 years and the levels recorded in the last few years were below the detection limit of the reference measurement method to a large extent. According to the 39th BImSchV, the obligation to measure SO2 does therefore no longer apply. Heavy metals and benzo(a)pyrene were additionally determined in the PM10 fraction at two or four measurement stations, respectively.
The stations are distributed throughout the city in such a way that various spatial influencing factors can be ascertained. Of the 17 stations at which air pollutants are measured to assess the quality of the air, seven are located along heavily travelled streets, five in inner-city areas (both residential and commercial) and five at the periphery of the city or in forest areas. Additionally, special measurements are recorded along the A100 motorway, which are not used to monitor limits.
The staff of the Berlin Air Quality Monitoring Network analyse the samples collected at the 23 RUBIS sites at a laboratory and determine the benzene and soot levels. In addition, passive collectors are used at more than 30 locations in total to determine nitrogen dioxide levels and, in some cases, nitrogen oxide levels. Samples are collected over a sampling period of 14 days, which are then analysed at a laboratory. This manually generated laboratory data is only published upon completion of all quality assurance measures as an annual data set (incl. 2-week values, available in the air data archive, only in German) and annual means in the annual mean reports, due to the delay between measurements and results caused by analysis, as well as long measurement intervals.
Every weekday around 11am, the measured values of the previous day, which are automatically determined by the measurement containers, are sent to several newspapers and radio and TV stations for public broadcast. Additionally, the data is published hourly or daily on the Internet, and may be accessed there, for example, under _Tageswerte des BLUME-Messnetzes_ (“Daily values of the BLUME measurement network”; only in German). In the case of increased ozone concentrations in the city, this information is also broadcast to the public by some radio stations. ozone concentrations in the city, this information is also broadcast to the public by some radio stations. As mentioned above, the _Berliner Luftgütemessnetz_ (Berlin Air Quality Measurement Network) website offers a comprehensive range of data and analyses.
Monthly and annual reports, which, in addition to an evaluation of the preceding measurement period, also contain site tables of the measurement stations and an overview of limit and target values, are also available online (only in German).
The results of the measurements of the last years allow the following conclusions to be drawn:
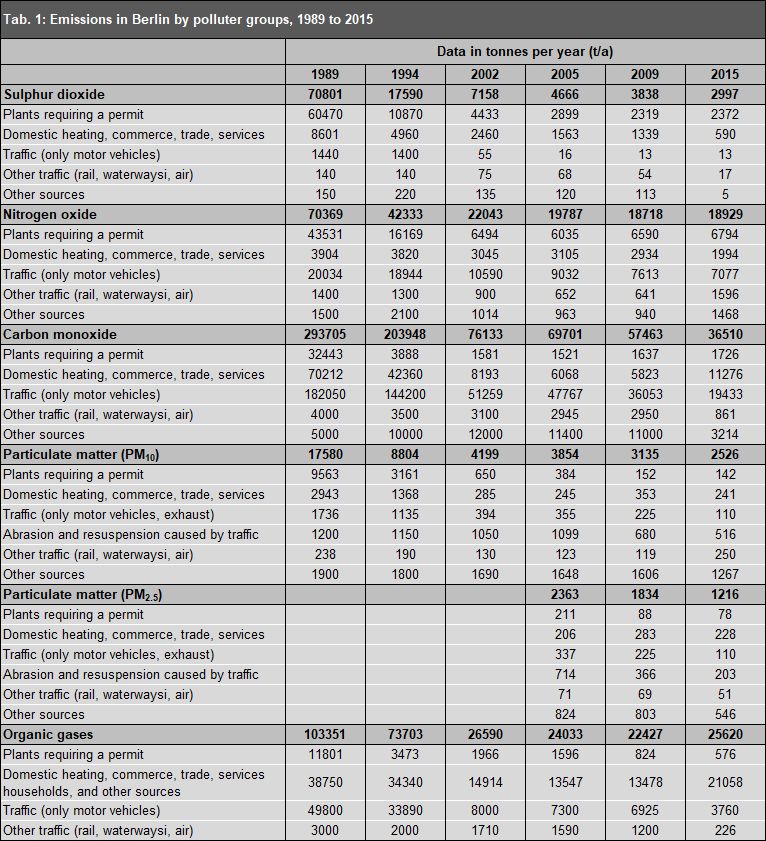
- Compared with the 1970s and ’80s, the atmospheric burden of most air pollutants has been reduced by orders of magnitude. Thus, for example, sulphur dioxide concentrations have been reduced by > 90 %, and under no circumstances exceed the EU limit values for immissions.
With regard to PM10, the situation has improved significantly compared to the years at the beginning of this century. However, the PM10 burden strongly depends on the meteorological conditions of propagation. In particular, high pressure conditions in winter with low southerly to easterly winds lead to a high accumulation of PM10 particulates in the air in the Berlin area, some of which are brought to Berlin by long-distance transport and some of which originate from sources within the city, primarily road traffic and domestic heating. In the years with worse exchange conditions, such as 2009-2011 and also 2014, the annual mean PM10 concentrations were slightly higher, whereas in the years with better exchange conditions, such as 2007 and 2008 as well as 2012, 2013, 2015, 2016, 2017 and 2019, they were correspondingly lower. The annual mean concentrations of PM10 for 2022 detected at the stations of the automatic monitoring
network were 15-16 µg/m³ in the suburbs, 17-19 µg/m³ in inner-city areas and 20-24 µg/m³ along heavily travelled streets. Therefore, the annual mean limit was not exceeded even at the measuring point with the highest load. Also, the short-term limit value for PM10 (the daily mean must not exceed the value of 50 µg/m³ more than 35 times a year per measurement station) was not exceeded at any measuring point in 2022.
- As in the previous year, the annual mean limit of the 39th BImSchV (40 µg/m³) for NO2, effective since 2010, was also complied with throughout Berlin. At the automatic measurement stations, the annual mean along streets ranged between 20 and 33 µg/m³ in 2022. All sites with passive collectors that meet the site criteria according to the 39th BImSchV also complied with the limit.
- Target values for near-ground ozone (only in German) were not exceeded at any station in 2022. The EU-wide target of a maximum of 25 days per calendar year with a maximum 8-hour value of above 120 µg/m³, averaged over the last 3 years, applies here. Since January 1, 2010, this target has to be met as far as possible.
- Improvements of the air quality have to do with many components. The deindustrialisation of Berlin, the modernisation of plants, the use of catalytic converters in vehicles, and the changeover to more low-emission heating fuels had an impact.
The detailed overview and compilation of the quality of Berlin’s air is provided online here (only in German).
But since immissions are also influenced by supra-regional effects and weather events, an analysis of causes should not be carried out locally only, but should rather also investigate the immission of pollutants from outside, including cross-border transportation (cf. Air Quality Plan, 2nd Update).
For the present Map 03.12.1 Long-Term Development of Air Quality – Immissions, all available data collected in the measurement programmes described over the past 45 years was compiled and prepared statistically and graphically with regard to the measurement year. For spatial distribution of current and former measurement sites, the following data can be accessed for each station:
- address
- type of station
- description of neighbourhood (including photos)
- coordinates
- measurement parameters
- period of measurement
- measured values (as diagrams and as EXCEL tables).
The stations are divided into the categories traffic, residential area, industrial, suburban, and meteorological stations.
A total of 201 measurement sites are presented, of which 58 were in operation in 2022 (17 BLUME measurement containers, one special measurement station, 23 RUBIS measurement points and 17 additional locations with passive collectors).
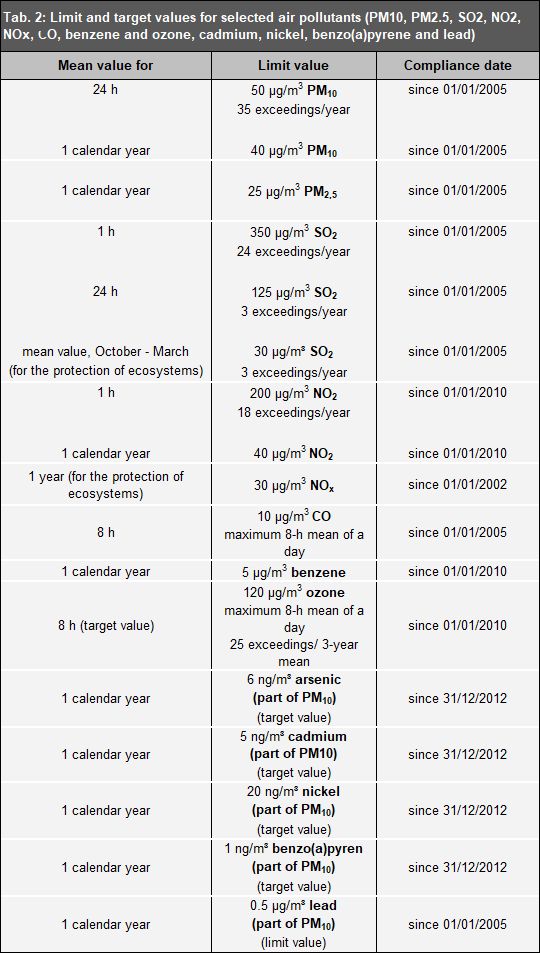
For the graphic representation of the development of the parameters total dust, particulate matter (PM10), sulphur dioxide (SO2), nitrogen dioxide (NO2), nitrogen monoxide (NO), carbon monoxide (CO), benzene and ozone (O3), the following limit and target values were referred to, which serve the purposes of health protection, unless otherwise stated: