Expected Highest Groundwater Level (EHGL) 2022

Methodology

The current map was developed in individual sections corresponding to the different geological units of Berlin, in the following order:

  1. Glacial valley
  2. Panke valley
  3. Teltow Plateau and Nauen Plate,
  4. Barnim Plateau to the south-east of the Panke valley

whereby different methodologies were applied in part.

Glacial valley

For the area of the Berlin glacial valley, the EHGL map was developed using a numerical groundwater flow model. This was necessary, as the groundwater surface has been influenced by humans for a long time, in some cases heavily. This means that an EHGL map cannot be calculated based on measured groundwater levels only, according to the EHGL definition mentioned earlier.

A numerical model allows the spatially discrete simulation of groundwater levels considering geohydraulic conditions. These include new groundwater formation, which is a function of precipitation among other things, and the water levels of the surface waters. Both are subject to natural and also artificially induced fluctuations. For example, in our climate area, new groundwater formation occurs mainly in the winter half of the year, with the result that the highest groundwater levels within a year usually occur in the spring. Often, relatively high water levels of the surface waters (here the Spree, the Havel and their tributaries) further contribute to the high groundwater levels during this time. Particularly high groundwater levels are observed when the amount of precipitation is significantly higher than the long-term mean for several consecutive years. During these extremely wet periods, it is expected that the groundwater will rise to the highest groundwater level in the area under observation.

Beginning in 2003, a numerical groundwater flow model has been developed, which, shall be available permanently for the entire area of Berlin for addressing water management questions at the state level. By 2008, this model had reached a stage which enabled it to be used to create an EHGL map for the area of the Berlin glacial valley. This map was subsequently used by the Senate Department’s specialists for groundwater advice and has thus thoroughly proved itself in practice.

The development of the EHGL map for the Berlin glacial valley is described in Limberg, Hörmann & Verleger (2010) and is summarised here:

The numerical model, for which the software system MODFLOW was used, is designed to encompass the entire area of Berlin (Figure 3).

Fig. 3: Area of the groundwater flow model for developing the EHGL map for the Berlin glacial valley

Fig. 3: Area of the groundwater flow model for developing the EHGL map for the Berlin glacial valley

The area of the Berlin glacial valley is divided vertically into several model layers, of which the uppermost represents the – here usually unconfined – main aquifer, for which the highest groundwater level is to be calculated.

Horizontally, the model is divided into rectangular cells. The cell size varies between 50 × 50 and 100 × 100 metres.

Further modelling occurred in the following steps:

  • Model calibration
    After the known or estimated geohydraulic conditions (levels of receiving waters, groundwater extractions, groundwater feeds, etc.) had been specified, the model was essentially calibrated by varying a given distribution of the water conductivity using hydraulically stationary calculations. The mean values of the data with respect to groundwater use and the groundwater levels of the year 2004 were selected for this purpose. The year 2004 may be regarded as climatically average.
  • Model verification
    Model verification here refers to a test of the model as to whether it can represent a known load situation of the groundwater that deviates from the calibration period (e.g. altered groundwater extractions) with respect to the actually observed groundwater heights with sufficient accuracy. In this case, the groundwater levels for the year 2001, which differ from the year 2004 in particular with respect to the distribution of groundwater withdrawal, were calculated using the model. The deviations of the model-calculated groundwater levels from the observed ones were found to be relatively small. Thus, the model reached an important quality milestone.
  • Model simulation of the expected highest groundwater level and plausibility test
    After verification, different model simulations for calculating the highest groundwater level were performed. In summary, three types of hydraulic conditions had to be modified accordingly for this purpose. Those that form the basis for the model calibration and the verification apply to climatically average years and a specific groundwater load. The three conditions are:
    • groundwater use
      According to the EHGL definition, neither groundwater extractions nor feeds into the groundwater occur in this scenario. This is true both for the waterworks and for other extractions, such as for personal water supply, remediation or construction.
    • height of the receiving waters for groundwater
      The water levels of the receiving waters for the so-called HGL case were defined through evaluation of the gauge heights.
    • new groundwater formation
      When the highest groundwater level occurs, the new groundwater formation must be significantly higher than the long-term mean. For estimation purposes, guideline model simulations were carried out followed by plausibility tests based on selected groundwater level measurements. As a result, in case of HGL, the new groundwater formation was set up to 15% higher than the long-term annual mean, depending on its level specific to the location.

The completion of this preliminary EHGL map was followed by an intensive plausibility test using the data of about 2,200 groundwater measuring points and various other sources of data and information (for the locations of the groundwater measuring points used for the plausibility test, see Fig. 4). The map only required minor modifications subsequently.

These modifications included the introduction of the representation of riparian strips along some of the surface waters. In these areas, which are separately designated on the map, EHGL values are stipulated that were not directly calculated using the large-scale groundwater flow model. This was necessary because in some riparian areas, strong short-term increases in the water levels of the receiving waters can lead to a rise in the groundwater surface close to the shore, which cannot be covered with sufficient certainty by the map derived from a hydraulically stationary calculation. Separate EHGL values were also established for individual areas for which the modelled map may show values that are too unreliable due to a relatively low model discretisation, e.g. in the vicinity of locks and in some riparian areas along the Tegeler See. These EHGL values were determined based on maximum gauge heights measured for the surface waters, and in some cases approximative hydraulically non-stationary calculations.

Fig. 4: Location of the groundwater measuring points used for the plausibility test of the EHGL map

Fig. 4: Location of the groundwater measuring points used for the plausibility test of the EHGL map

The methodology of the EHGL map also includes its ongoing review, particularly after very high groundwater levels have been observed. After the map was completed, such extremely high groundwater levels were recorded in the period from 2008 to 2011. The map passed the test very successfully based on this groundwater level data. Only minimal changes were carried out subsequently. The published map is now set up such that the HGL that applies at the individual measuring points, i.e. which is regarded as uninfluenced, is at least 10 cm lower than the EHGL shown.

Panke valley

The EHGL map in the area of the Panke valley was originally going to be developed using the same methodology as that used for the glacial valley, i.e. using a numerical groundwater simulation model. Thus, a separate groundwater model was first created for this area, which is generally available for questions of water management and has already been used. However, when preparing this model, it became apparent that the required hydrological and hydrogeological data is relatively sparse in some areas. The calculation of a preliminary EHGL map and its critical evaluation led to the assessment that in these areas the model does not yet meet the particularly high quality requirements set out for an EHGL model.

The anthropogenic influence on the groundwater in the Panke valley is relatively small, in contrast to the Berlin glacial valley. Therefore, more directly measured HGL values can be taken into account in developing the EHGL map in this case. The EHGL map for the area of the Panke valley does not only include the Panke valley in the strict sense, as defined on the geological map of Berlin, but also a small adjacent part of the glacial valley. This is a transition area between the two geological units, which hydrogeologically rather belongs to the Panke valley with its relatively shallow uppermost aquifer.

The methodological approach is described in Hörmann & Verleger (2016) and is summarised here as follows:

1. Hydrograph analysis

All hydrographs of the 135 groundwater measuring points from the Senate Department’s archive that are installed in the Panke valley aquifer (GWL 1.2 according to the aquifer nomenclature of Limberg & Thierbach 2002) were checked for suitability for the present purpose. This included in particular an assessment of the groundwater levels with respect to potential artificial influence and potential data errors. The essential result of this investigation was that the groundwater levels are significantly more often and usually also more strongly influenced before 1990 than after. An essential cause for this is the operation of the sewage farms in the northern part of the Panke valley, which was ended in the 1980s and caused a significant rise in the groundwater level locally. The highest groundwater levels measured during the operation of the sewage farms do not count as expected highest groundwater levels. As a result of this hydrograph analysis, only measurements since 1990 have been used to determine EHGL values.

2. Determining the EHGL values

The highest groundwater level (HGL) was extracted for every single groundwater measuring point that was recognised as suitable. To determine the EHGL, an increment was added to the HGL:

EHGL = HGL + increment

The increment was determined based on various considerations for estimating the reliability of the recording of highest groundwater levels. In particular, the frequency of measurements and the observation duration of the groundwater measuring points were taken into account. The minimum increment added to the HGL is 0.3 m. This value applies to measuring points that capture the period from 2007 to 2012 well through frequent measurements. In Berlin, the highest groundwater levels under the currently prevailing geohydraulic conditions (cf. EHGL definition) were generally observed in this period (see example Fig. 5).

HGL values of groundwater measuring points that do not cover periods of generally high groundwater levels and/or have a lower measuring frequency were incremented by 0.5 m or 0.7 m.

Fig. 5: Example of a hydrograph from the Panke valley with HGL, EHGL and increment

Fig. 5: Example of a hydrograph from the Panke valley with HGL, EHGL and increment

3. Calculation of the EHGL map

On the basis of 105 suitable groundwater measuring points and their EHGL values as sample values, the distribution of the EHGL was calculated using the software system SURFER, without taking bodies of water into account, and was represented in the form of lines of equal EHGL. The calculation method is the same as the one used for the current groundwater isolines map (Hannappel, Hörmann & Limberg 2007).

In addition, the following should be noted in general:

Since the EHGL map has been made available for different applications, the expected highest groundwater levels include no application-specific blanket safety increments, as are required e.g. in the regulations relevant for the construction of buildings. The increments added to the HGL (0.3 to 0.7 m, see Methodology), which differ across the area of the Panke valley in some cases, were chosen solely due to the varying quality of recording the highest groundwater levels and the relatively large natural amplitude of the groundwater graph here, compared to the glacial valley. In the glacial valley, the values shown in the EHGL map are at least 0.1 m higher than the highest measured groundwater levels that have been determined to be relevant. In the area of the cone of depression of the Berlin waterworks, however, the EHGL is predominantly much higher than the HGL, which registers on a metre scale.

Thus, the EHGL estimates have been determined using computational methods based on comprehensive data and various other sources of information. According to current knowledge, they are on the “safe side” – in the sense that they will most likely not be exceeded. Another consequence is that they may not necessarily reach the maximum height specified.

The methodology for the development of the map also includes an ongoing review, i.e. a comparison with the current groundwater levels. A comprehensive check of the map, which is based on the data prior to 2007, was carried out in 2013, after extremely high groundwater levels had been recorded in Berlin in 2008 and 2011. The result demonstrated that even in times of extreme precipitation the EHGL values were not exceeded.

Teltow Plateau and Nauen Plate

The development of an EHGL map for the areas of the Teltow Plateau and the Nauen Plate began in 2013. In 2017, it was completed for these two hydrogeological units and is published here for the first time together with the EHGL maps for the glacial valley and the Panke valley.

The method used to develop this map is essentially the same as that used for the glacial valley map, i.e. the map was created based on a numerical groundwater flow model (Hörmann & Verleger 2020). As was the case for the glacial valley, the use of a simulation model was required here because of the long-term anthropogenic influence on the groundwater levels, especially by the Beelitzhof, Tiefwerder and Kladow waterworks. The main differences are listed below:

The existent four-layer groundwater model for Berlin was used for further vertical differentiation. The model is now divided into eight layers. This was necessary to accommodate the hydrogeological layer structure of the Teltow Plateau and the Nauen Plate that is considerably more complex than that of the glacial valley. Figure 6 shows a North-South section through the model, as it currently exists for the entire Berlin area. The model layers L 1 to L 6 represent the main aquifer, which is locally differentiated into the aquifers GWL 2.1, GWL 2.2 and GWL 2.3, which are hydraulically separated from each other – especially in the plateau areas – by layers of boulder marl with low water conductivity.

Fig. 6: Section of the numerical groundwater flow model for the State of Berlin

Fig. 6: Section of the numerical groundwater flow model for the State of Berlin

The year 2001 was used for calibration and the year 2004 for verification, based on their advantageous data on the observed groundwater levels.
As for the glacial valley area, the EHGL simulation was carried out following the calibration and verification process. Data from about 1,100 groundwater measuring points was used to implement the plausibility test and a required recalibration of the EHGL model.
Based on the plausibility test of the Teltow Plateau and the Nauen Plate map, identifying riparian strips separately along individual bodies of water turned out to be superfluous here, in contrast to the glacial valley. Essentially, only a small area on the Nauen Plate west of Kladow was subsequently modified on the model-calculated map, i.e. where a hydrogeological anomaly was taken into account by indicating areas with the same EHGL values based on the highest groundwater levels observed.

Barnim Plateau south-east of the Panke valley

In the course of developing the numerical groundwater flow model for the Barnim Plateau, it emerged that the required hydrogeological data is relatively poor in some areas. Furthermore, it became clear that the complexity of the hydrogeological conditions, which are highly intricate in some parts, could not always be mapped with sufficient accuracy. A very strict analysis of the calculated EHGL map revealed that one section of the EHGL model does not yet meet the particularly high quality requirements set out for an EHGL model.

Similar to the Panke valley, HGL measurements were therefore initially used to develop the EHGL map. Groundwater levels from the year 2000 were used for this purpose. This is possible, as anthropogenic influence has become rather insignificant as a factor, following the cessation of water pumping at the Buch waterworks and the levelling of sewage farms in the 1990s.

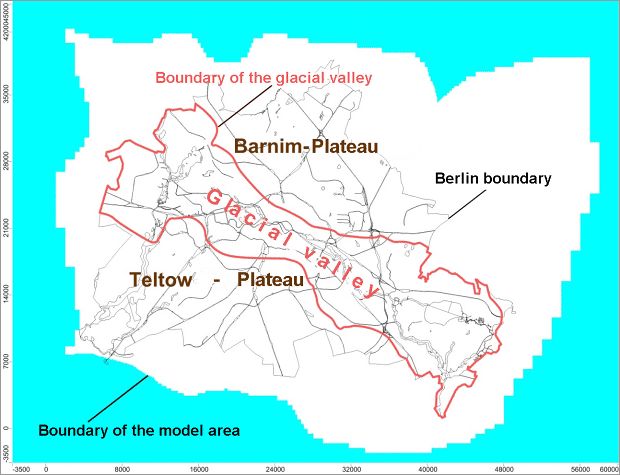
The EHGL map for the area of the Barnim Plateau southeast of the Panke valley does not only include the plateau as presented on the geological map of Berlin, but also a small adjacent area, where the Panke valley transitions to the glacial valley (see Fig. 2). The area of the Barnim Plateau west of the Panke valley, however, is not included in these maps. On the one hand, the main aquifer does not cover a large area here. On the other hand, further analyses of the hydrogeological situation would be necessary to be able to provide reliable information on the EHGL.

The following steps were taken to calculate the EHGL map in the area of the Barnim Plateau located south-east of the Panke valley:

1. Hydrograph analysis

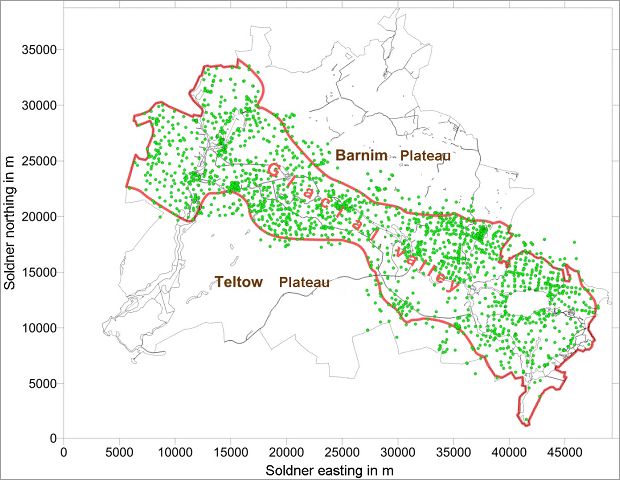
A statistical analysis was carried out for the groundwater levels of 43 representative groundwater measuring points, which the main aquifer filters (GWL 2.1, GWL 2.2, GWL 2) according to the aquifer nomenclature of Limberg & Thierbach (2002). Only data from the year 2000 and later was included in this evaluation. Prior to the year 2000, artificial groundwater recharge in the area of former sewage farms and the groundwater lowering by the Buch waterworks may have had a hydraulic impact on groundwater levels.

Initially, the data sets were checked for data errors. Furthermore, it was a prerequisite for use that the measurement series not contain any considerable measurement gaps and cover at least 80 % of the observation period. The groundwater level measured on day 15 of each month was used for evaluation.

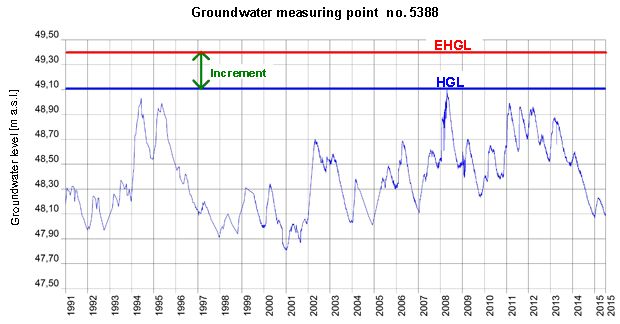
The aim of the evaluation was to determine the month with the highest groundwater levels in the observation period and to determine the maximum groundwater increase during the winter half of the year and caused by heavy precipitation events in the summer respectively.

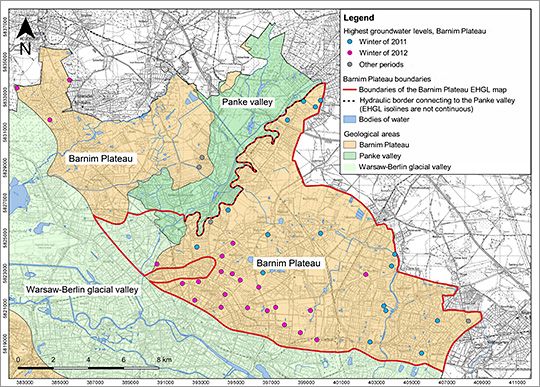
On the Barnim Plateau, the highest groundwater levels were measured in the winter of 2012 (23 groundwater measuring points) and the winter of 2011 (16 groundwater measuring points). In the winter months of 2008, maximum values were recorded at 3 groundwater measuring points and at 1 measuring point in 2002. February 2012 was the month with the highest groundwater levels with 21 peak values. In the winter of 2011, the highest groundwater levels were also recorded in February with 13 peak values. Figure 7 reveals that the measuring points that recorded maximum values in the winter of 2012 (highlighted in pink) are located in the southern section of the Barnim Plateau and in the north-west (Frohnau/Hermsdorf), while the measuring points that recorded maximum values in the winter of 2011 (highlighted in blue) are mainly located in the north and the east.

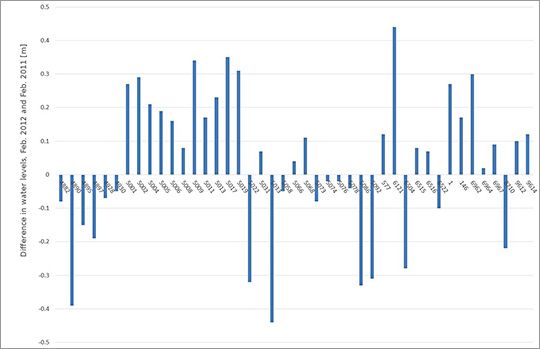
Figure 8 illustrates the difference in water levels between the two peak levels of winter 2012 and 2011. The groundwater levels recorded at the northern and eastern groundwater measuring points (highlighted in blue in Figure 7) in the winter of 2012 read up to 0.44 m below the maximum water levels in 2011. The median is 0.10 m lower than that of the water levels of 2011. In the southern groundwater measuring points (highlighted in pink in Figure 7), the 2012 water levels were 0.17 m higher on average than the 2011 water levels.

The highest groundwater increases across all groundwater measuring points investigated on the Barnim Plateau within a month is 0.39 m and can be attributed to heavy precipitation events that occurred in June/July 2017. When investigating groundwater increases across several months, the winter months from November 2010 to February 2011 stand out in particular, with an increase of 0.47 m in three months.

Fig. 7: Distribution pattern of groundwater measuring points by highest groundwater level (blue: winter of 2011; pink: winter of 2012)

Fig. 7: Distribution pattern of groundwater measuring points by highest groundwater level (blue: winter of 2011; pink: winter of 2012)

2. Defining EHGL values and calculating the EHGL map

The hydrograph analysis demonstrated that the overall highest groundwater levels were measured in February 2012. Hence, this date was chosen as the basis for calculating the EHGL map. In order to account for the influence of heavy precipitation events and persistent phases of precipitation in winter, these water levels were raised by 0.5 m. Figure 7 illustrates that the highest groundwater levels were measured in the winter of 2011 (highlighted in blue) in the northern and eastern sections of the Barnim Plateau. They were up to 0.44 m higher than those measured in February 2012 (cf. Figure 8). To account for this, the water levels of February 2012 were raised by an additional 0.4 m for these groundwater measuring points.

p=. Barnim Plateau EHGL = groundwater level (February 2012) + heavy precipitation increment (0.5 m) + increment in the north and east (0.4 m)

Fig. 8: Difference in water levels between February 15, 2012 and February 15, 2011 at 43 representative groundwater measuring points. Positive values indicate that the water level was higher in the winter of 2012 than in the winter of 2011 (corresponds to the groundwater measuring points highlighted in pink in Fig. 7)

Fig. 8: Difference in water levels between February 15, 2012 and February 15, 2011 at 43 representative groundwater measuring points. Positive values indicate that the water level was higher in the winter of 2012 than in the winter of 2011 (corresponds to the groundwater measuring points highlighted in pink in Fig. 7)

Based on this evaluation, EHGLs were calculated for all groundwater measuring points available on the Barnim Plateau. Furthermore, a groundwater equation map was created using the SURFER software system. The calculation methodology and the number of groundwater measuring points used are the same as those used for the current groundwater levels map (Hannappel, Hörmann & Limberg 2007).

3. Adjustments to match the glacial valley and the Panketal EHGL maps

The Barnim Plateau EHGL map connects directly to the glacial valley EHGL map in the south and was manually adjusted to match the existing map in the area of transition.

The Panke valley aquifer is the uppermost aquifer in its area. Hydraulically, it is largely separated from the main aquifer. The EHGLs of the Panketal aquifer are thus mapped in the area of the Panketal valley. As a result, the transition between the Panketal and the Barnim Plateau is not smooth. It is rather characterised by misaligned EHGL isolines, resulting from two hydraulically separated aquifers “colliding” on this map. In the southwest, in the area of transition to the glacial valley, however, the Panketal aquifer is no longer hydraulically separate from the main aquifer. From the isoline situated 42 m above sea level, the EHGL isolines of the Panktetal aquifer start to align with the hydrographs of the Barnim Plateau and the glacial valley EHGLs. In this area, the EHGLs determined for the Barnim Plateau are above those of the Panketal aquifer, bar a few exceptions (e.g. north-east of the Schäfersee). The Barnim Plateau EHGLs are therefore presented on the current map. This modification was necessary, as it was the only option to adjust the Barnim Plateau EHGL map to the already existing glacial valley and Panke valley EHGL maps in a hydrogeologically sound way.