As required in the “Directive on the Assessment and Management of Environmental Noise”, strategic noise maps graphically represent the noise situation in the following isophone classes:
Strategic Noise Maps 2007
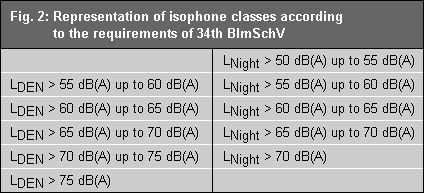
Fig. 2: Representation of isophone classes according to the requirements specified in the “Directive on the Assessment and Management of Environmental Noise”
Image: Umweltatlas Berlin
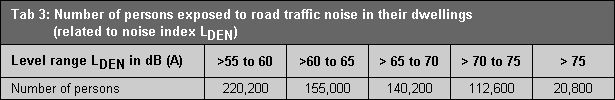
Table 3: Number of persons exposed to road traffic noise in their dwellings (related to noise index LDEN)
Image: Umweltatlas Berlin
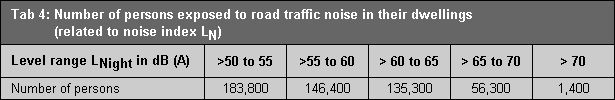
Table 4: Number of persons exposed to road traffic noise in their dwellings (related to noise index LN)
Image: Umweltatlas Berlin
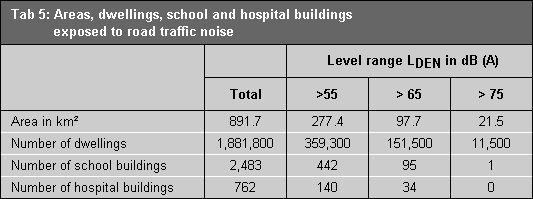
Table 5: Areas, dwellings, school and hospital buildings exposed to road traffic noise
Image: Umweltatlas Berlin
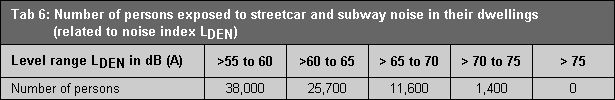
Table 6: Number of persons exposed to streetcar and subway noise in their dwellings (related to noise index LDEN)
Image: Umweltatlas Berlin
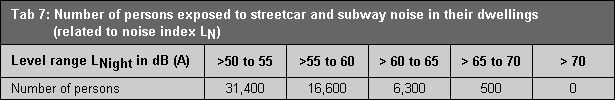
Table 7: Number of persons exposed to streetcar and subway noise in their dwellings (related to noise index LN)
Image: Umweltatlas Berlin
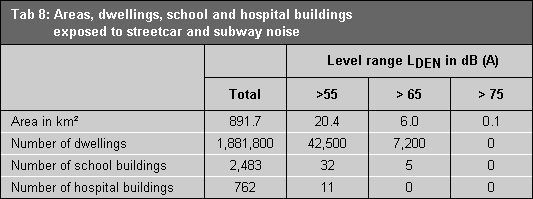
Table 8: Areas, dwellings, school and hospital buildings exposed to streetcar and subway noise
Image: Umweltatlas Berlin
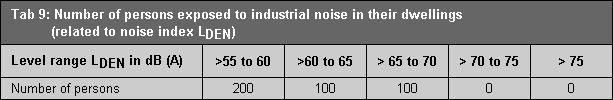
Table 9: Number of persons exposed to industrial and commercial noise in their dwellings (related to noise index LDEN)
Image: Umweltatlas Berlin
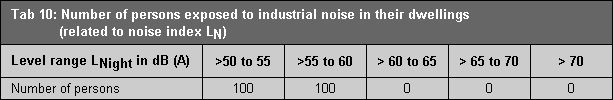
Table 10: Number of persons exposed to industrial and commercial noise in their dwellings (related to noise index LN)
Image: Umweltatlas Berlin
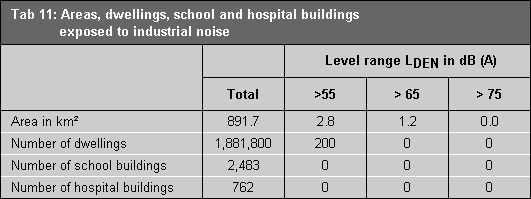
Table 11: Areas, dwellings, school and hospital buildings exposed to industrial and commercial noise
Image: Umweltatlas Berlin
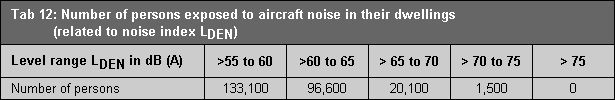
Table 12: Number of persons exposed to aircraft noise in their dwellings (related to noise index LDEN)
Image: Umweltatlas Berlin
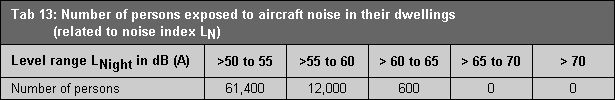
Table 13: Number of persons exposed to aircraft noise in their dwellings (related to noise index LN)
Image: Umweltatlas Berlin
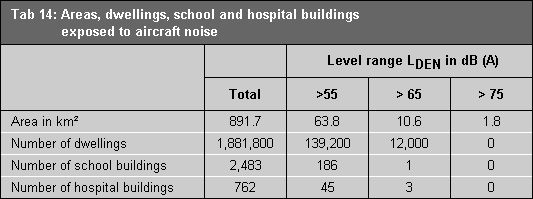
Table 14: Areas, dwellings, school and hospital buildings exposed to aircraft noise
Image: Umweltatlas Berlin
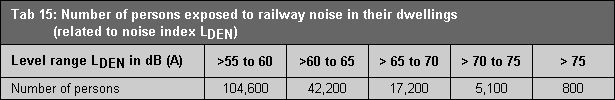
Table 15: Number of persons exposed to railway and suburban fast train noise in their dwellings (related to noise index LDEN)
Image: Umweltatlas Berlin
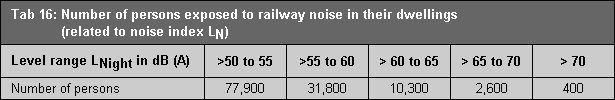
Table 16: Number of persons exposed to railway and suburban fast train noise in their dwellings (related to noise index LN)
Image: Umweltatlas Berlin
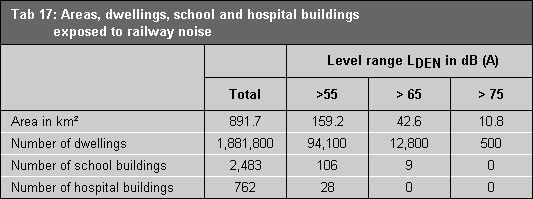
Table 17: Areas, dwellings, school and hospital buildings exposed to railway and suburban fast train noise
Image: Umweltatlas Berlin